本稿の目的は、論文に用いることができるレベルの図をgnuplotで制作することです。
gnuplotはVersion 5.2 patchlevel 8を利用しています。
方針
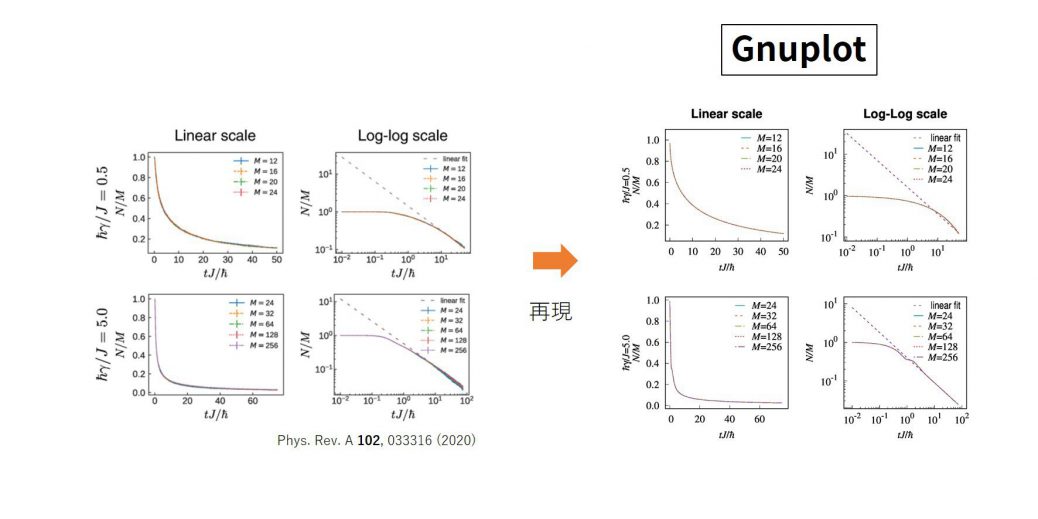
本稿の方針としては、実際の論文からとってきた図を再現することです。
元データはないので、あくまで枠線や、フォントなどを合わせることを目的とします。
対象とする図は以下の[1]の図3と[2]の図3にします。
これらを選んだ理由は特にないですが、これらを再現することを目標にします。
[1]の図3を再現
ではまず、Phys. Rev. A 102, 033316 (2020)の図3を再現しましょう。
[1]の図3
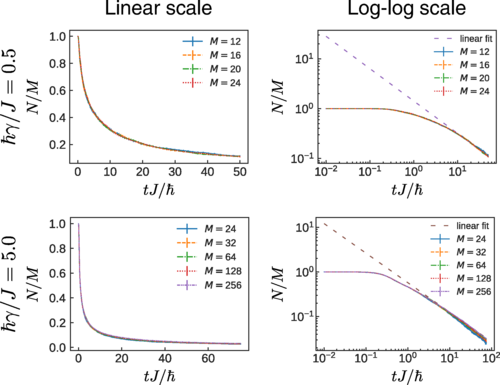
[1]の図3をgnuplotで再現した図
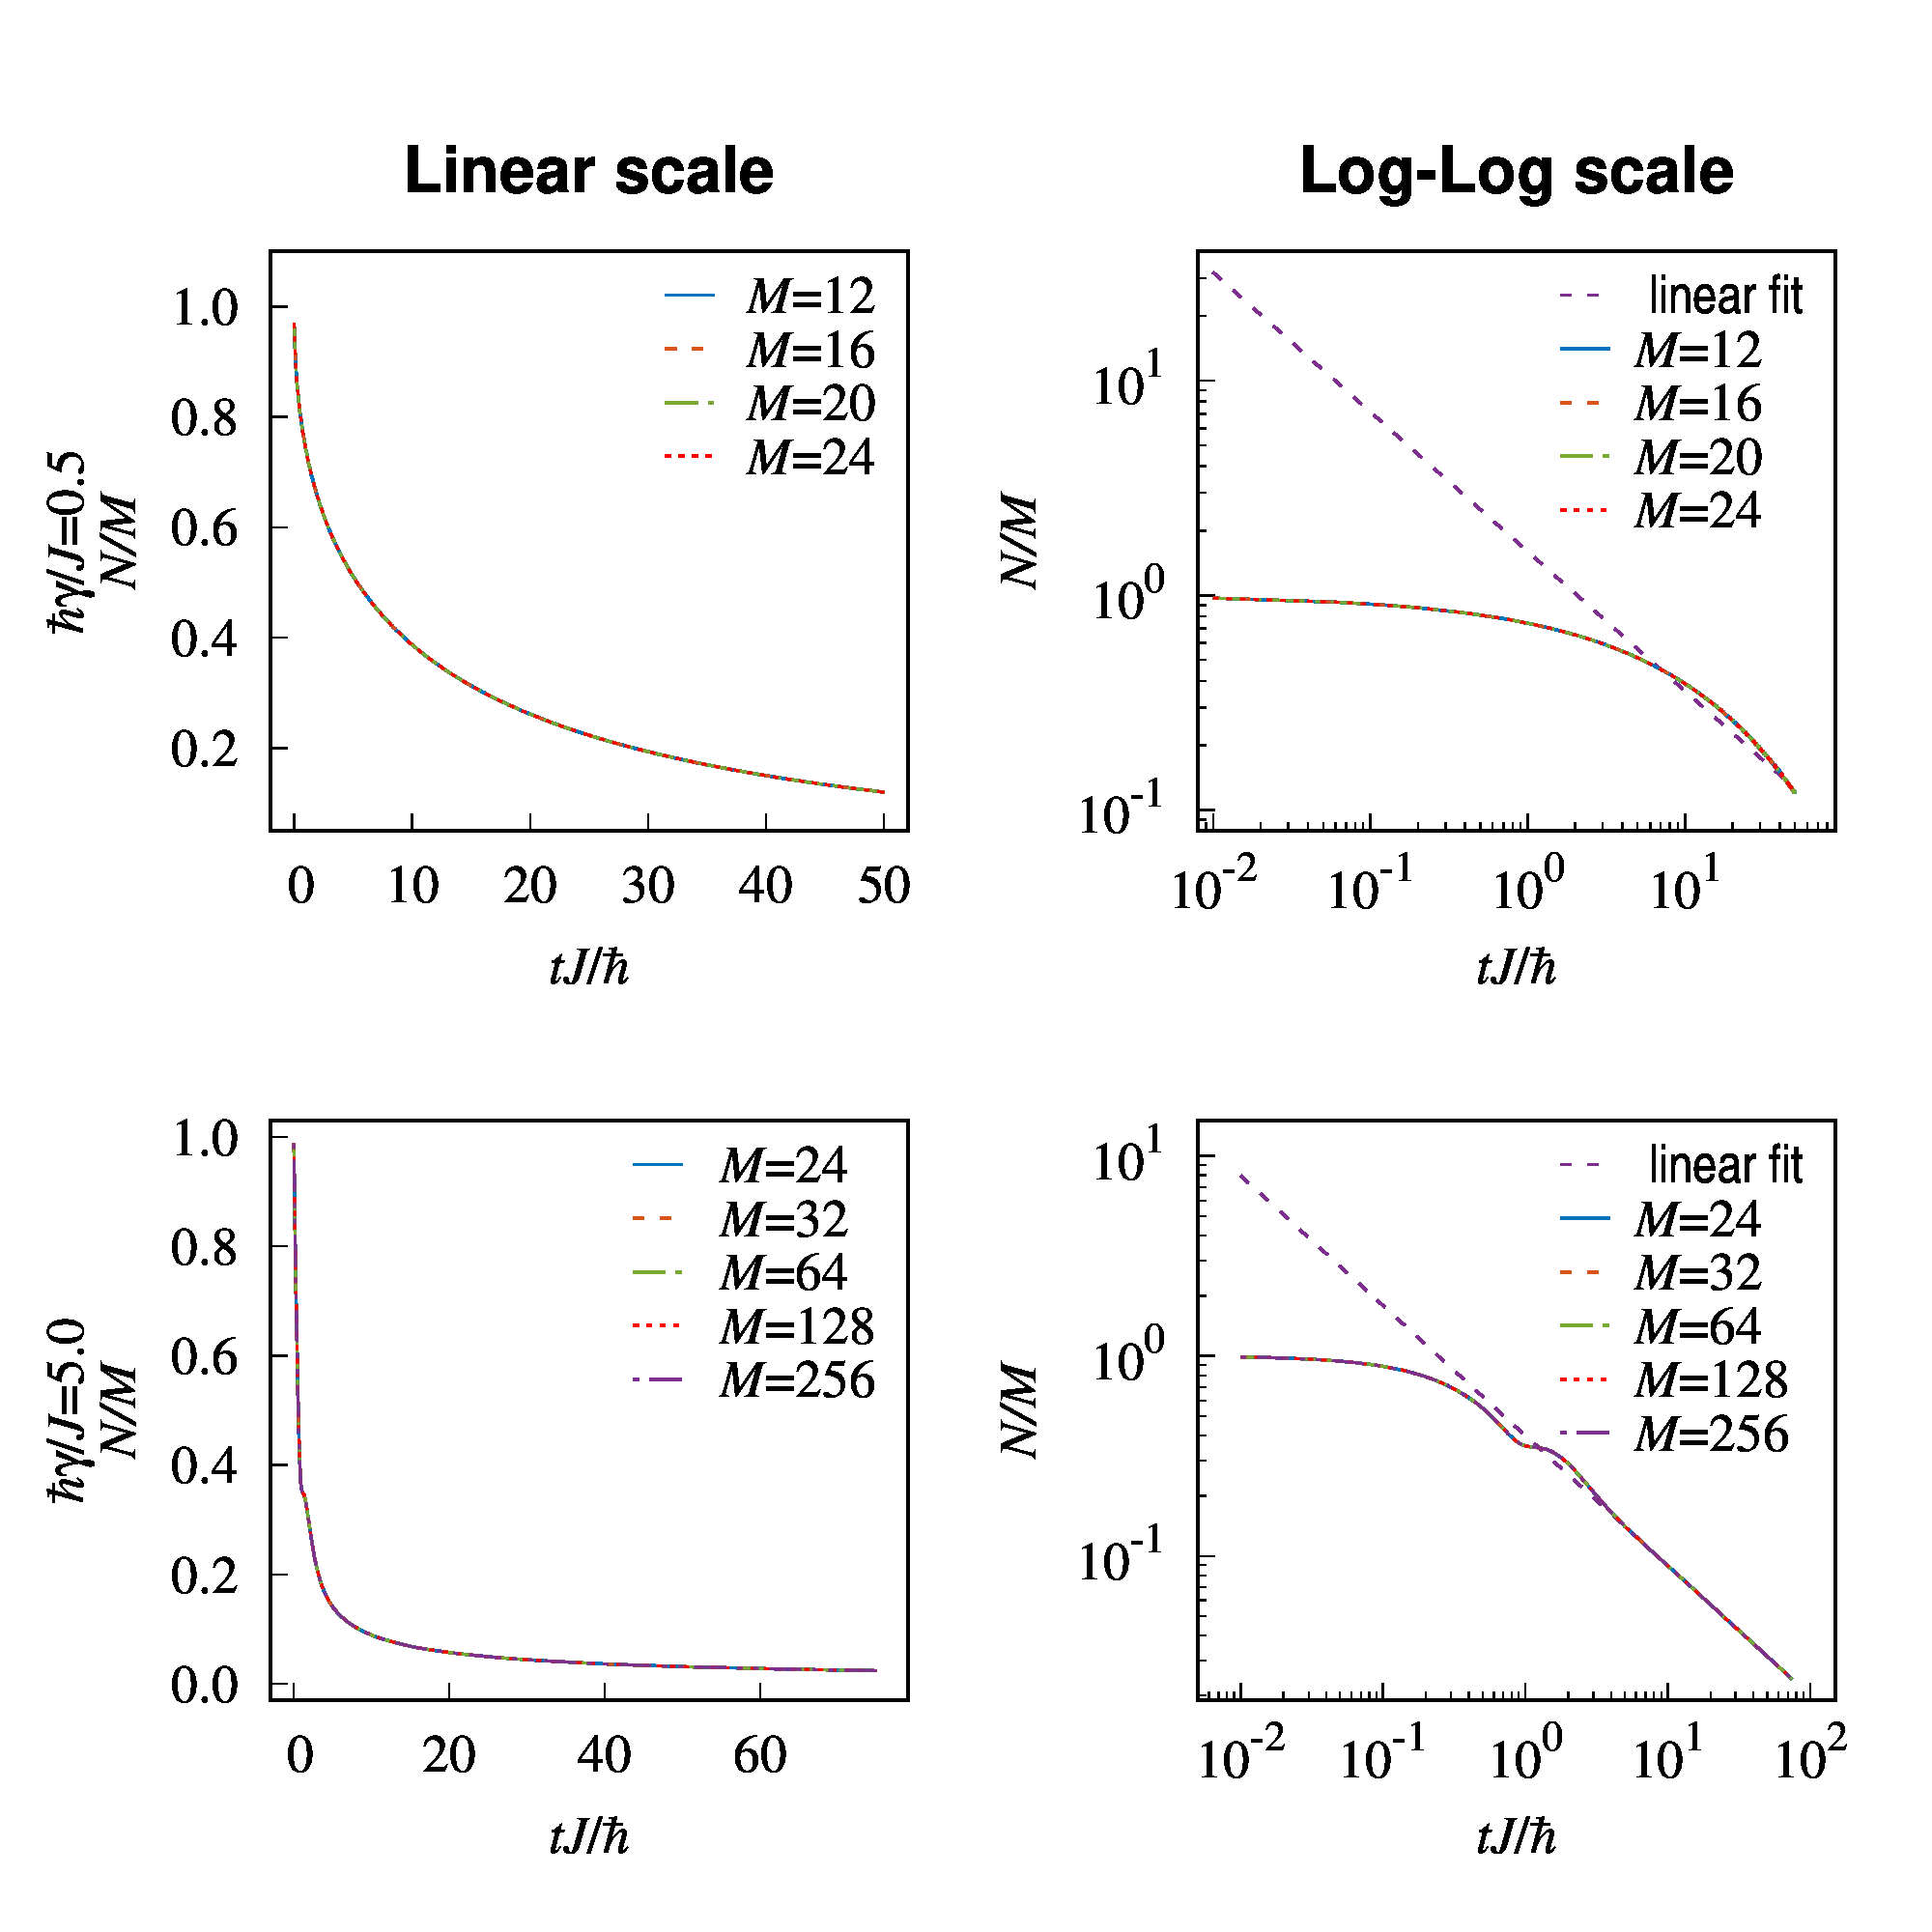
gnuplotで用いた全コードは以下に折りたたんでおきます。
reset
set terminal wxt dashed enhanced font 'Times New Roman,20'
# line color definition
set linetype 1 lc rgb '#0072bd' lw 1 # blue
set linetype 2 lc rgb '#d95319' lw 1 # orange
set linetype 3 lc rgb '#77ac30' lw 1 # green
set linetype 4 lc rgb '#ff0000' lw 1 # red
set linetype 5 lc rgb '#7e2f8e' lw 1 # purple
set linetype 6 lc rgb '#a52a2a' lw 1 # brown
# left top figure(1) position
lx1=0.14; ly1=0.87
rx1=0.47; ry1=0.57
# right top figure(2) position
lx2=0.62; ly2=ly1
rx2=0.95; ry2=ry1
# left bottom figure(3) position
lx3=lx1; ly3=0.42
rx3=rx1; ry3=0.12
# right bottom figure(3) position
lx4=lx2; ly4=ly3
rx4=rx2; ry4=ry3
if(@ARG1 == 1){
set terminal postscript eps size 5,5 dashed enhanced color font 'Roman,20'
set output "PRA102_033316_Fig3.eps"
}
set multiplot
set lmargin screen lx1
set tmargin screen ly1
set rmargin screen rx1
set bmargin screen ry1
set title "{/Gothic-bold=24 Linear scale}" offset 0,0
set key reverse samplen 1 width 0
unset log x
set xr[-2:52]
set xtics 10 nomirror
set mxtics 1
set format x "%2.0f"
set xl "{/Roman-Italic {/=20 tJ}}/{/=14 @^{/Symbol=14 -}{/Roman-Italic {/=20 h}}}"
unset log yr
set yr[0.05:1.1]
set ytics 0.2 nomirror
set mytics 1
set format y "%2.1f"
set yl "{/=14 @^{/Symbol=14 -}{/Roman-Italic {/=20 h}}}{/Symbol=20 g}/{/Roman-Italic {/=20 J}}=0.5\n{/Roman-Italic {/=20 N/M}}" offset 0,0
plot "hJ0.5.d" u 1:2 w l lw 2 lc 1 dashtype 1 ti "{/Roman-Italic M}=12",\
"hJ0.5.d" u 1:2 w l lw 2 lc 2 dashtype 2 ti "{/Roman-Italic M}=16",\
"hJ0.5.d" u 1:2 w l lw 2 lc 3 dashtype 4 ti "{/Roman-Italic M}=20",\
"hJ0.5.d" u 1:2 w l lw 2 lc 4 dashtype 3 ti "{/Roman-Italic M}=24"
#-------------------------------
set lmargin screen lx2
set tmargin screen ly2
set rmargin screen rx2
set bmargin screen ry2
set title "{/Gothic-bold=24 Log-Log scale}" offset 0,0
set key reverse samplen 1 width -5 # width : to compress between character and sample
set log x
set xr[8e-3:9e1]
set format x "10^{%L}"
set xtics 10 nomirror
set mxtics 10
set xl "{/Roman-Italic {/=20 tJ}}/{/=14 @^{/Symbol=14 -}{/Roman-Italic {/=20 h}}}"
set log y
set yr[8e-2:4e1]
set format y "10^{%L}"
set ytics 10 nomirror
set mytics 10
set yl "{/Roman-Italic {/=20 N/M}}" offset 0,0
plot "hJ0.5_fit.d" u 1:2 w l lw 2 lc 5 dashtype 2 ti "{/Gothic-Condensed linear fit}",\
"hJ0.5.d" u 1:2 w l lw 2 lc 1 dashtype 1 ti "{/Roman-Italic M}=12 ",\
"hJ0.5.d" u 1:2 w l lw 2 lc 2 dashtype 2 ti "{/Roman-Italic M}=16 ",\
"hJ0.5.d" u 1:2 w l lw 2 lc 3 dashtype 4 ti "{/Roman-Italic M}=20 ",\
"hJ0.5.d" u 1:2 w l lw 2 lc 4 dashtype 3 ti "{/Roman-Italic M}=24 "
#-------------------------------
set lmargin screen lx3
set tmargin screen ly3
set rmargin screen rx3
set bmargin screen ry3
unset title
set key reverse samplen 1 width -1
unset log x
set xr[-3:79]
set xtics 20 nomirror
set mxtics 1
set format x "%2.0f"
set xl "{/Roman-Italic {/=20 tJ}}/{/=14 @^{/Symbol=14 -}{/Roman-Italic {/=20 h}}}"
unset log yr
set yr[-0.03:1.03]
set ytics 0.2 nomirror
set mytics 1
set format y "%2.1f"
set yl "{/=14 @^{/Symbol=14 -}{/Roman-Italic {/=20 h}}}{/Symbol=20 g}/{/Roman-Italic {/=20 J}}=5.0\n{/Roman-Italic {/=20 N/M}}" offset 0,0
plot "hJ5.d" u 1:2 w l lw 2 lc 1 dashtype 1 ti "{/Roman-Italic M}=24 ",\
"hJ5.d" u 1:2 w l lw 2 lc 2 dashtype 2 ti "{/Roman-Italic M}=32 ",\
"hJ5.d" u 1:2 w l lw 2 lc 3 dashtype 4 ti "{/Roman-Italic M}=64 ",\
"hJ5.d" u 1:2 w l lw 2 lc 4 dashtype 3 ti "{/Roman-Italic M}=128",\
"hJ5.d" u 1:2 w l lw 2 lc 5 dashtype 5 ti "{/Roman-Italic M}=256"
#---------------------------
set lmargin screen lx4
set tmargin screen ly4
set rmargin screen rx4
set bmargin screen ry4
unset title
set key reverse samplen 1 width -5 # width : to compress between character and sample
set log x
set xr[5e-3:1.5e2]
set format x "10^{%L}"
set xtics 10 nomirror
set mxtics 10
set xl "{/Roman-Italic {/=20 tJ}}/{/=14 @^{/Symbol=14 -}{/Roman-Italic {/=20 h}}}"
set log y
set yr[1.9e-2:1.5e1]
set format y "10^{%L}"
set ytics 10 nomirror
set mytics 10
set yl "{/Roman-Italic {/=20 N/M}}" offset 0,0
plot "hJ5_fit.d" u 1:2 w l lw 2 lc 5 dashtype 2 ti "{/Gothic-Condensed linear fit}",\
"hJ5.d" u 1:2 w l lw 2 lc 1 dashtype 1 ti "{/Roman-Italic M}=24 ",\
"hJ5.d" u 1:2 w l lw 2 lc 2 dashtype 2 ti "{/Roman-Italic M}=32 ",\
"hJ5.d" u 1:2 w l lw 2 lc 3 dashtype 4 ti "{/Roman-Italic M}=64 ",\
"hJ5.d" u 1:2 w l lw 2 lc 4 dashtype 3 ti "{/Roman-Italic M}=128 ",\
"hJ5.d" u 1:2 w l lw 2 lc 5 dashtype 5 ti "{/Roman-Italic M}=256 "
unset multi
if(@ARG1 == 1){
set out
set terminal wxt enhanced
}
データは適当に作成しました。データのダウンロードは以下からどうぞ。
https://slpr.sakura.ne.jp/qp/supplement_data/PRA102_033107_Fig3likedata.tar.gz
細かな説明をしていきます。
- 線の色の指定
線の色はlinetypeで決定していきます。
set linetype 1 lc rgb '#0072bd' lw 1 # blue
の意味は、gnuplotでプロットした時の1番目の線を、カラーコード’#0072bd’, 線の太さ”1″とすることを指定しています。プロット時に”lc 1″としてもこの1番目の色に変更できるようになります。linetype 6まで同じです。
- 複数画面の表示位置指定
続いて、
# left top figure(1) position
lx1=0.14; ly1=0.87
rx1=0.47; ry1=0.57
~~~
set lmargin screen lx1
set tmargin screen ly1
set rmargin screen rx1
set bmargin screen ry1
の部分について説明します。個別画面の左上の座標\((lx1, ly1)\)と右下の座標\((rx1, ry1)\)を決定します。座標の原点は全体の左下\((0,0)\), 全体の右上\((1,1)\)としたときに決められます。実際にその値を適用しているのがlmargin, tmarginなどです。詳しい説明は、gnuplotで複数の図を載せるを参照してください。
- eps出力のためのターミナル指定
if(@ARG1 == 1){
set terminal postscript eps size 5,5 dashed enhanced color font 'Roman,20'
set output "PRA102_033107_Fig3.eps"
}
の部分は、出力ターミナルの設定を行っています。条件分岐は引数によってターミナルに出力するのか、epsとして画像出力するのかを指定するためです。使いやすさのためです。重要なのは、 size 5,5 の箇所です。ここを正方形にしておかないとxyの比が変わってしまうので扱いづらくなります。
eps画像の切り抜き(Boundary boxの変更)はgsviewなどでできるので、画面四方の空白はいくらあってもよいです。そのサイズをgnuplot上で合わせるよりも、gnuplotで思った通りの出力をすること優先しましょう。
フォントも重要ですね。経験上、2×2の画像であればsize5,5の時フォントサイズ20よいと思います。論文の本文はRomanフォントが使われるため、図もRomanにしておいたほうがよいでしょう。
- 個別画面の細かい指定
- タイトルの指定
set title "{/Gothic-bold=24 Linear scale}" offset 0,0
タイトルを指定します。図のLinear scaleと書かれた太字です。[1]の図を見ると、どうもゴシック体の太字で書いているようです。なので、フォントをGothic-boldとして、文字の大きさを24に変更します。
- 凡例の指定
set key reverse samplen 1 width 0
凡例はkeyで指定します。reverseは凡例の中の”文字-線の種類”の表示順を”線の種類-文字”に変更します。samplenは、凡例内の線の長さを変更する(デフォルトで4)、wigthは線の種類と文字の間隔を指定するパラメータとして考えればよいでしょう。具体的な値は実際に出力させて何度も気に入るまでトライアンドエラーしています。
- x,y軸の設定
unset log x
set xr[-2:52]
set xtics 10 nomirror
set mxtics 1
set format x "%2.0f"
set xl "{/Roman-Italic {/=20 tJ}}/{/=14 @^{/Symbol=14 -}{/Roman-Italic {/=20 h}}}"
軸設定をまとめて説明しますが、特に特殊文字の出力が難しいと思うのでここに注目します。プランク定数は特殊文字であり、postscriptターミナルでは出力することができないと思います。なので、文字hとハイフンを組み合わせて出力しています。私が思いついたわけではなくググりました。[4]に詳細が書いてありまして、それから持ってきました。文字サイズが違うので適当に合わせました。
y軸も同じですので、省略します
- グラフのプロット
plot "hJ5_fit.d" u 1:2 w l lw 2 lc 5 dashtype 2 ti "{/Gothic-Condensed linear fit}",\
"hJ5.d" u 1:2 w l lw 2 lc 1 dashtype 1 ti "{/Roman-Italic M}=24 ",\
"hJ5.d" u 1:2 w l lw 2 lc 2 dashtype 2 ti "{/Roman-Italic M}=32 ",\
"hJ5.d" u 1:2 w l lw 2 lc 3 dashtype 4 ti "{/Roman-Italic M}=64 ",\
"hJ5.d" u 1:2 w l lw 2 lc 4 dashtype 3 ti "{/Roman-Italic M}=128 ",\
"hJ5.d" u 1:2 w l lw 2 lc 5 dashtype 5 ti "{/Roman-Italic M}=256 "
最後にグラフをプロットします。dashtypeは実線、破線を決定するパラメータです。私の環境では実線が1, 破線は2以降になっていますが、環境によって違うかもしれません。各自合わせましょう。
また、linear fitという文字は、なんというかギュッとまとまっています。しかもRoman体ではなくゴシック体です。これを指定するには、
ti "{/Gothic-Condensed linear fit}"
と入力することで実現可能です。
以上でおおよその説明が終わりです。
重要なのはトライアンドエラーです。ターミナルによって表示が異なるので、postscriptで出力すると決めたら確認はpostscriptで行いましょう。実際に最終出力図をqtターミナルの表示上では、このようになります。
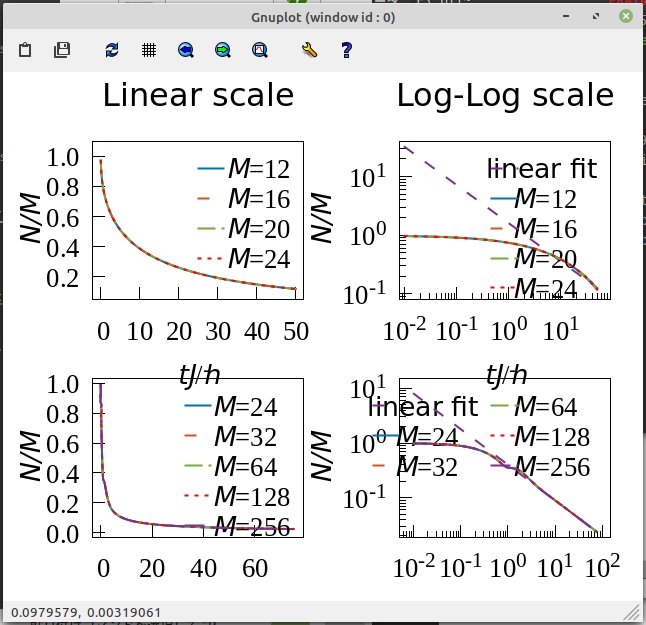
ベクタ形式であるEPS画像のサイズは102.5kBです。論文に投稿する場合でも許容できるサイズではないでしょうか。
ラスタライズ形式であるPNGをimagemagickを用いて
convert -density 400x400 -background white -flatten -alpha off PRA102_033316_Fig3.eps PRA102_033316_Fig3.png
で変換すると、91.8kBです。この程度の差であれば、ベクタ形式のほうが良いでしょう。
[2]の図3を再現
続いてPhys. Rev. A 102, 033107 (2020)の図3を再現しましょう。
大きな違いはカラーマップを利用した図であることです。
[2]の図3
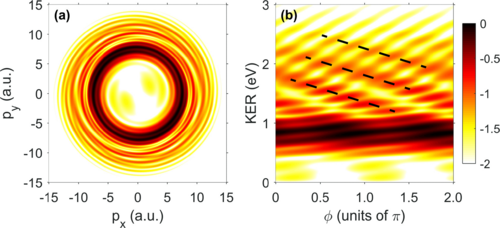
[2]の図3をgnuplotで再現した図
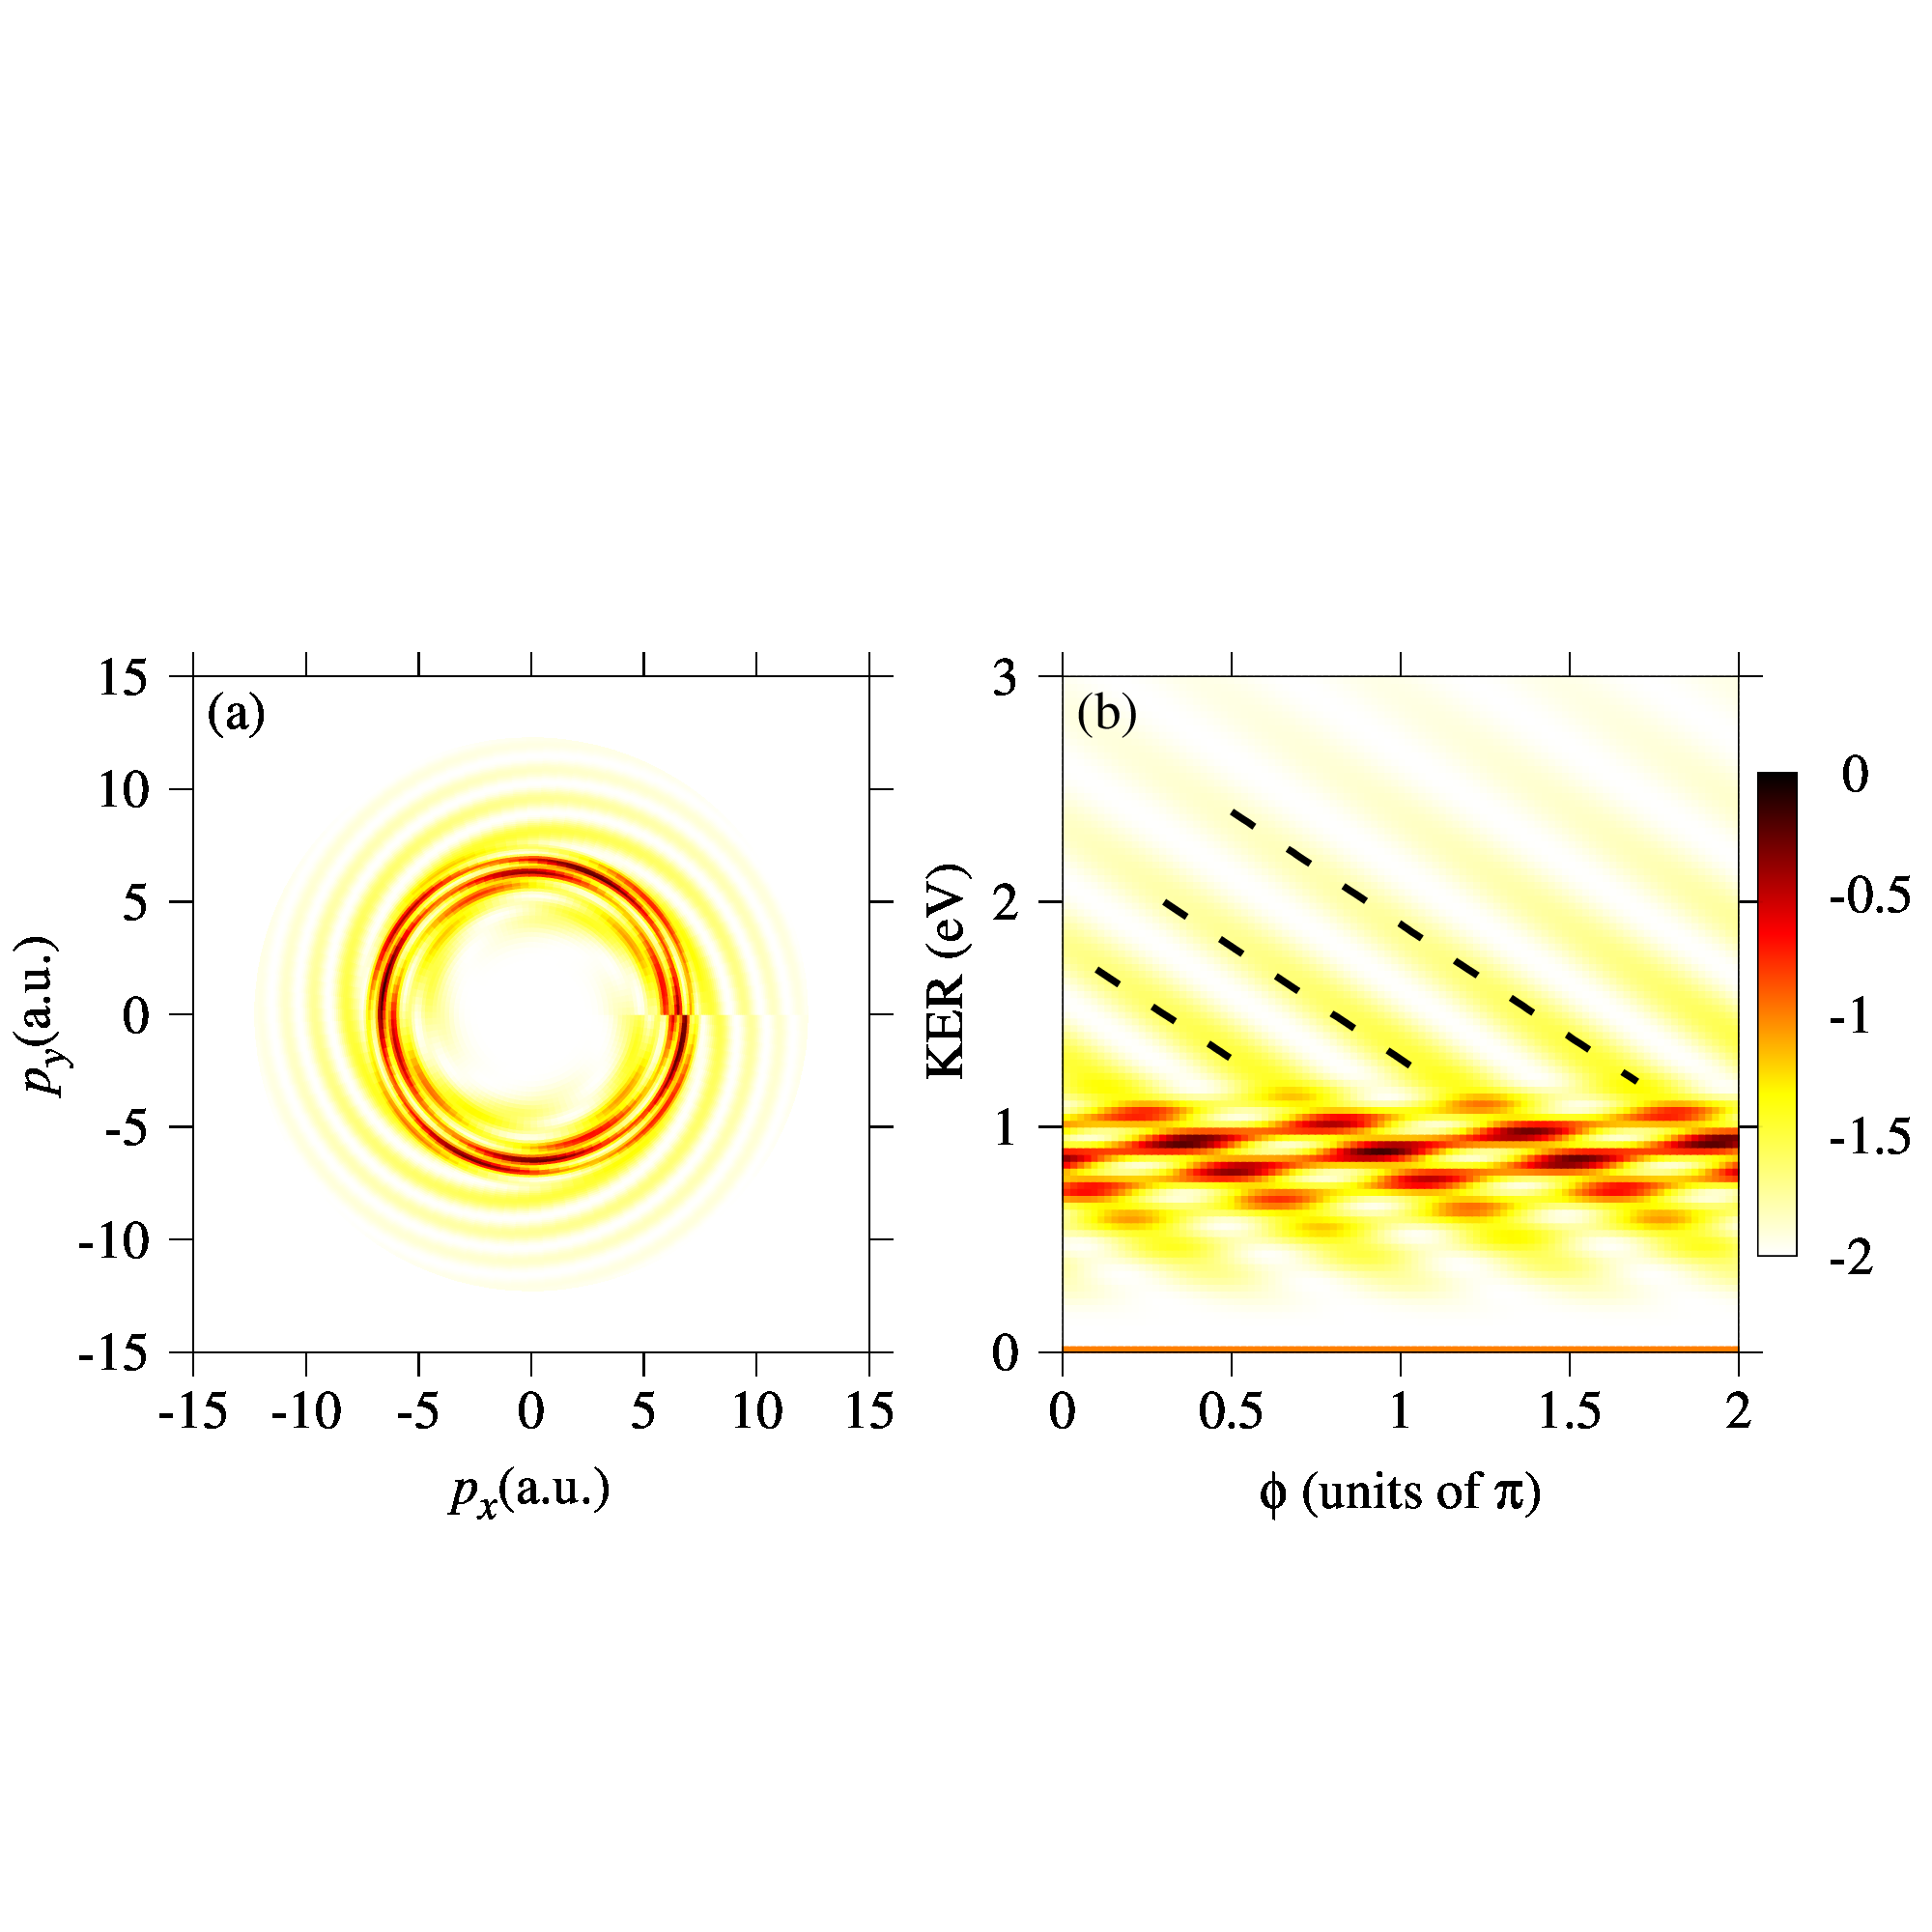
データは適当に作成しました。データのダウンロードは以下からどうぞ。
https://slpr.sakura.ne.jp/qp/supplement_data/PRA102_033107_Fig3likedata.tar.gz
reset
set terminal wxt dashed enhanced font 'Times New Roman,20'
set palette rgb 21,22,23 negative # colormap setting
# left figure(1) position
lx1=0.10; ly1=0.3
rx1=0.45; ry1=0.65
# right figure(2) position
lx2=0.55; ly2=ly1
rx2=0.90; ry2=ry1
if(@ARG1 == 1){
set terminal postscript eps size 5,5 dashed enhanced color font 'Roman,20'
set output "PRA102_033107_Fig3.eps"
}
set multiplot
set lmargin screen lx1
set tmargin screen ly1
set rmargin screen rx1
set bmargin screen ry1
set pm3d map
unset label
set format x "%g"
set xl "{/Roman-Italic p_x}(a.u.)" offset 0,0.8
set xr[-15:15]
set xtics 5 mirror out offset 0,0.8
set mxtics 1
set format y "%g"
set yl "{/Roman-Italic p_y}(a.u.)" offset 0.8,0
set yr[-15:15]
set ytics 5 mirror out offset 0.8,0
set mytics 1
set cbtics 0.5
set cbr[-2:0]
unset colorbox
set label tc rgb "black" at graph 0.02, graph 0.95 front "(a)"
splot "KERphi.d" u (5*sqrt(2*$2)*cos($1*pi)):(5*sqrt(2*$2)*sin($1*pi)):(10*$2 < 1 ? 1/0: 2*$3 ) notitle
#-----------------------------
set lmargin screen lx2
set tmargin screen ly2
set rmargin screen rx2
set bmargin screen ry2
set xl "{/Italic {/Symbol-Oblique f}} (units of {/Symbol p})" offset 0,0.8
set xr[0:2]
set format x "%2.1f"
set xtics 0.5 mirror out offset 0,0.8
set mxtics 1
set format x "%g"
set yl "KER (eV)" offset 0,0.8
set yr[0:3]
set ytics 1 mirror out offset 0.8,0
set mytics 1
unset key
set cbtics 0.5 scale 0 # scale 0, to delete tics line in colorbox
set cbr[-2:0]
set colorbox user origin 0.91,0.35 size 0.02,0.25 border # change size of colorbox
unset label
set label tc rgb "black" at graph 0.02,graph 0.95 front "(b)"
splot "KERphi.d" u 1:2:($3*2) with pm3d,\
"l1.d" u 1:2:($1>0.5 ? 1/0 : 0) w l lw 5 lc rgb "black" dashtype 2,\
"l2.d" u 1:2:($1>1.1 ? 1/0 : 0) w l lw 5 lc rgb "black" dashtype 2,\
"l3.d" u 1:2:($1>1.8 ? 1/0 : 0) w l lw 5 lc rgb "black" dashtype 2
unset multi
if(@ARG1 == 1){
set out
set terminal wxt enhanced
}
※ギリシャ文字Φは、
とすることでギリシャ文字のイタリックを用いることができます。
[1]と同じ部分がかなりあるので、違う部分だけを説明していきます。
- カラーマップの設定
見た目で[3]の’hot’と呼ばれるカラーセットだとわかったので、それを用います。
set palette rgb 21,22,23 negative # colormap setting
ただし、カラーマップの色が反対になっているので、それを指定するnegativeを追加しています。
- カラーボックスの設定
unset colorbox
~~~~
set cbtics 0.5 scale 0 # scale 0, to delete tics line in colorbox
set cbr[-2:0]
set colorbox user origin 0.91,0.35 size 0.02,0.25 border # change size of colorbox
カラーボックスに注目すると、左図(a)はカラーボックスがないですが、右図(b)にはあります。なので、カラーボックスを出力しないunset colorboxを指定しています。
また、(b)のカラーボックスはカラーの値を示すところにticsが入ってないため、cbticsのscale(ticsの線の大きさ)を0にしています。
さらに見ると、カラーボックスの大きさが少し小さいです。なので、カラーボックスの大きさ位置を指定するために、set colorbox user origin …を指定しています。
- テキストボックスの表示
set label tc rgb "black" at graph 0.02, graph 0.95 front "(a)"
グラフ上のテキスト(a), (b)は、テキストボックスを追加して画面上に表示します。上のような指定で表示できます。
ベクタ形式であるEPS画像のサイズは752kBです。論文に投稿する画像としては、許容できるといえばできるサイズですが、若干大きいです。
ラスタライズ形式であるPNGをimagemagickを用いて
convert -density 400x400 -background white -flatten -alpha off PRA102_033107_Fig3.eps PRA102_033107_Fig3.png
で変換すると296kBです。2倍少し容量が小さくなるので論文全体の画像数が多いのならば、ラスタライズ形式の方が良いかもしれません。共著者と相談するとよいでしょう。
以上で説明を終わります。
参考文献
[1]S. Goto and I. Danshita, “Measurement-induced transitions of the entanglement scaling law in ultracold gases with controllable dissipation”, Phys. Rev. A 102, 033316 (2020)
[2]Z. Chen and F. He, “Interference of nuclear wave packets carrying different angular momenta in the dissociation of H2+ in strong circularly polarized laser pulses”, Phys. Rev. A 102, 033107 (2020)
[3]color mapについて
http://www.gnuplotting.org/?s=color
[4]6.4 What if I need h-bar (Planck’s constant)? -gnuplot FAQ
http://www.gnuplot.info/faq/#x1-610006.4
そのほか有用なページ
gnuplotでoption詰め込んで論文用figureを作ってみた[1] -qiita, @ucc_white
https://qiita.com/ucc_white/items/544b85e009a58d046d3c
Gnuplotのいろは -東京工業大学 科学技術創成研究院 佐藤千明研究室
http://www.csato.pi.titech.ac.jp/From2014/software/how-to-gnuplot.html


