gnuplotで、線の色を少し変化させながら色を付けていきます。
複数の線をグラデーション
set linetype 1 lc rgb "#ff0000" lw 1
set linetype 2 lc rgb "#ff1f1f" lw 1
set linetype 3 lc rgb "#ff3f3f" lw 1
set linetype 4 lc rgb "#ff5f5f" lw 1
set linetype 5 lc rgb "#ff7f7f" lw 1
set linetype 6 lc rgb "#ff9f9f" lw 1
set linetype 7 lc rgb "#ffbfbf" lw 1
set linetype 8 lc rgb "#ffdfdf" lw 1
set linetype 9 lc rgb "#0000ff" lw 1
set linetype 10 lc rgb "#1f1fff" lw 1
set linetype 11 lc rgb "#3f3fff" lw 1
set linetype 12 lc rgb "#5f5fff" lw 1
set linetype 13 lc rgb "#7f7fff" lw 1
set linetype 14 lc rgb "#9f9fff" lw 1
set linetype 15 lc rgb "#bfbfff" lw 1
set linetype 16 lc rgb "#dfdfff" lw 1
plot for[i=1:8] 0.2*i*x w l lw 2 lc i lt 1 title sprintf("%d",i)
replot for[i=9:16] -0.2*(i-8)*x w l lw 2 lc i lt 1 title sprintf("%d",i)
を実行すると、
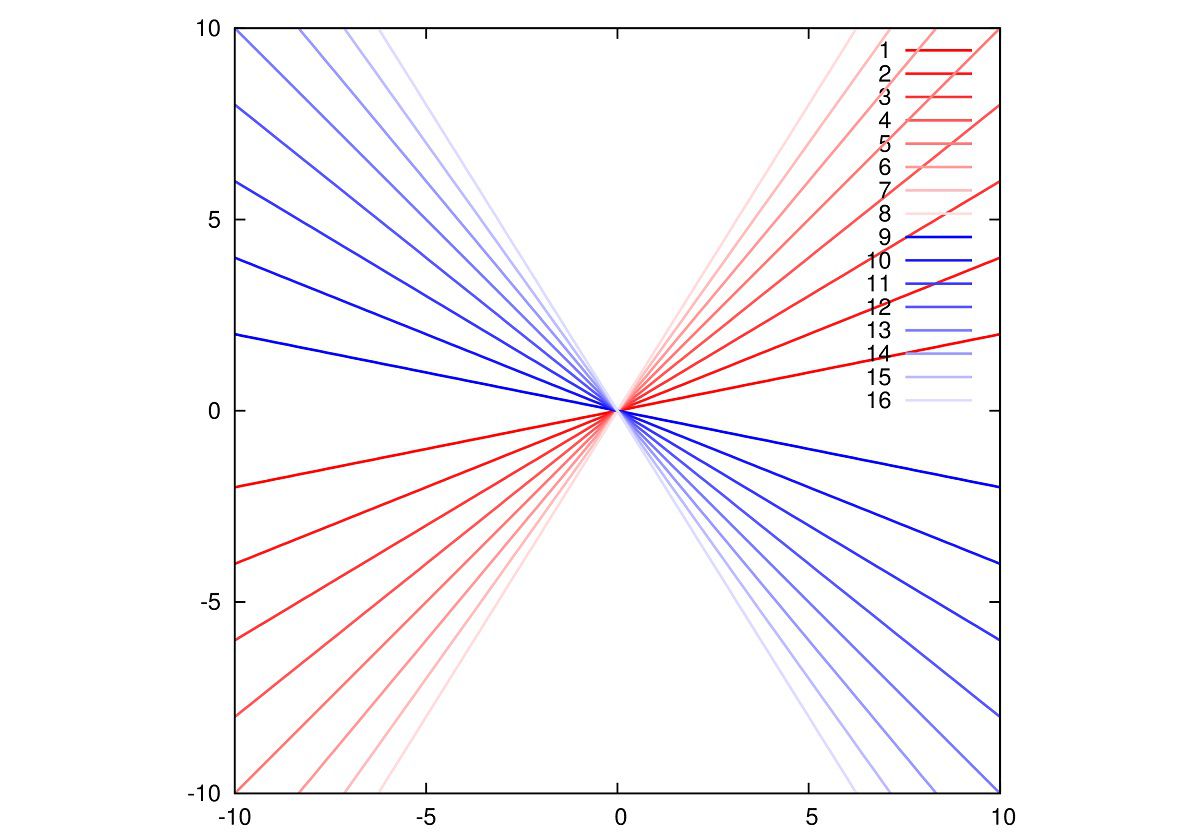
という画像を得ます。
1つの線をグラデーション
set table "d1.d"
plot x
unset table
set table "d2.d"
splot "d1.d" u 1:2:2
unset table
plot "d2.d" u 1:2:3 w l lw 4 lc palette
plot x
unset table
set table "d2.d"
splot "d1.d" u 1:2:2
unset table
plot "d2.d" u 1:2:3 w l lw 4 lc palette
を実行すると、
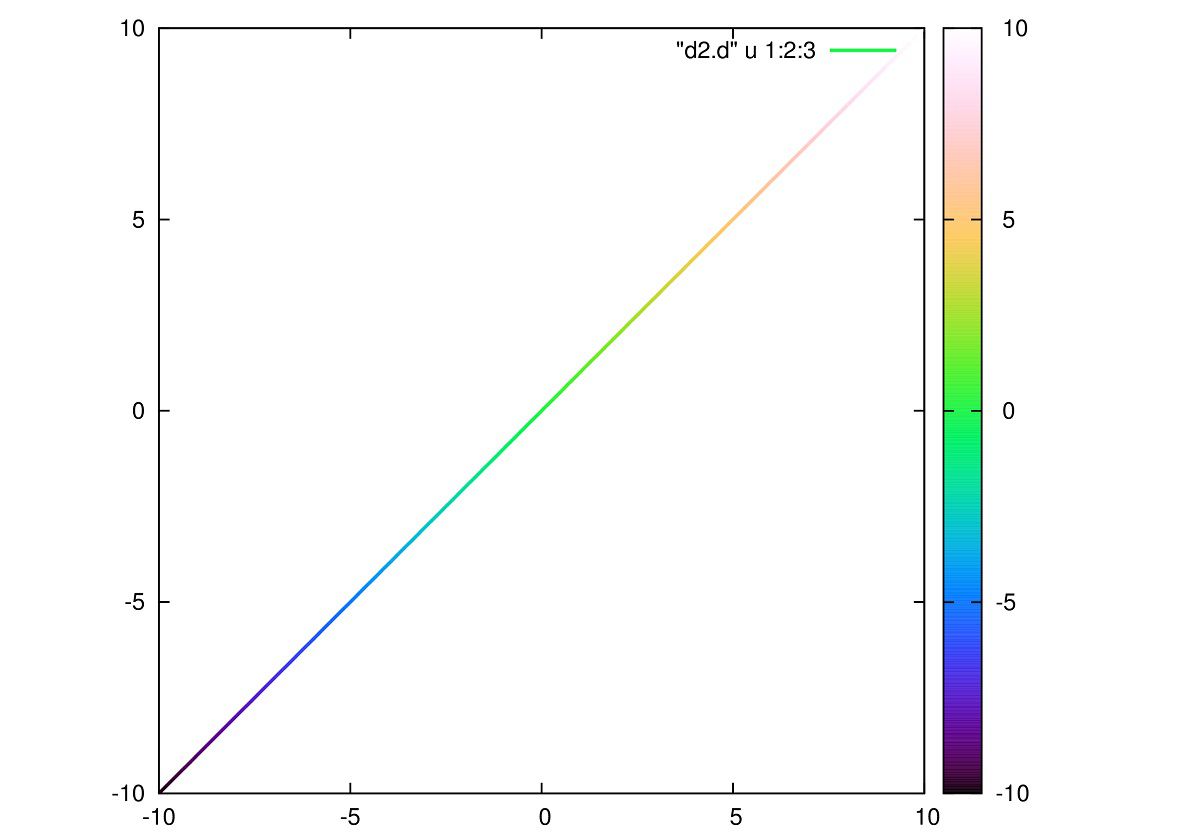
と言うグラフが得られます。縦軸の値に応じた色で付けられます。