グラフ作成用の関数 #
1. x-y グラフを画像として保存する関数 plot_xy #
def plot_xy
import numpy as np
import matplotlib.pyplot as plt
import matplotlib.ticker as tck


# plt.rcParams["axes.prop_cycle"] = plt.cycler(
#    color=["#000000", "#ff0000", "#0000ff", "#228b22", "#ff00ff", "#ffd900", "#00ffff", "#7f00ff", "#ff7f00", "#00ff7f", "#bebebe", "#666666"]
# )


def plot_xy(
    x_dict: dict[str, np.ndarray],
    y_dict: dict[str, np.ndarray],
    y_dict_error: dict[str, np.ndarray] = {},
    output_image_name: str | None = None,  # "out.png"
    show_gui: bool = True,
    data_optional: dict[str, dict] | None = None,
    title_name: str = "x-y graph",
    title_font_size: int | str = "default",
    title_v_offset: float | int | str = "default",
    figure_size: tuple[int, int] = (7, 5),
    aspect_ratio: str | float = "auto",
    legend_loc: tuple[float, float] | str | None = None,  # ,"upper left",
    legend_transparent: float = 0.5,
    legend_bg_color: str = "default",
    legend_edge_color: str = "default",
    x_scale: str = "linear",
    x_base: float | int | str = "auto",
    x_start_tick: float = None,
    x_end_tick: float = None,
    x_range: tuple[float, float] | str = "auto",
    x_major_ticks_manual: tuple | None = None,
    x_label: str = "$x$",
    x_grid: str = "major",
    x_ticks_direction: str = "in",
    is_x_minor_ticks: bool = False,
    x_minor_ticks_manual: tuple | None = None,
    x_minor_division: int = 1,
    x_invert: bool = False,
    y_scale: str = "linear",
    y_base: float | int | str = "auto",
    y_range: tuple[float, float] | str = "auto",
    y_start_tick: float = None,
    y_end_tick: float = None,
    y_major_ticks_manual: tuple | None = None,
    y_label: str = "$y$",
    y_grid: str = "major",
    y_ticks_direction: str = "in",
    is_y_minor_ticks: bool = False,
    y_minor_ticks_manual: tuple | None = None,
    y_minor_division: int = 1,
    y_invert: bool = False,
    default_font_family: str = "Times New Roman",
    default_font_size: int = 10,
    default_font_set: str = "stix",
) -> None:
    plt.rcdefaults()

    plt.rcParams["font.family"] = default_font_family  # font
    plt.rcParams["font.size"] = default_font_size  # character size
    plt.rcParams["mathtext.fontset"] = default_font_set  # font Math

    # ===================
    # 1. Global settings
    # ===================

    # - Make figure and subplots
    fig, axs = plt.subplots(1, 1, figsize=figure_size)

    # - Aspect ratio
    axs.set_aspect(aspect_ratio, adjustable="box")

    # - Plot data and it's label in legend
    # print(data_optional, show_error_bar)
    if data_optional is None:
        for k in y_dict.keys():
            # if show_error_bar:
            if y_dict_error.get(k) is not None:
                axs.errorbar(x_dict[k], y_dict[k], yerr=y_dict_error[k], elinewidth=1, fmt=".-", ms=3, label=k, capsize=2, capthick=1)
            else:
                axs.plot(x_dict[k], y_dict[k], ".-", ms=3, label=k)
    else:
        for k in y_dict.keys():
            p = data_optional.get(k)
            if p is not None:
                fmt = p.get("fmt") if p.get("fmt") is not None else ".-"
                data_label = p.get("ti") if p.get("ti") is not None else k
                line_width = p.get("lw") if p.get("lw") is not None else 1
                line_color = p.get("lc") if p.get("lc") is not None else "C0"
                marker_size = p.get("ms") if p.get("ms") is not None else 3
                e_line_width = p.get("ew") if p.get("ew") is not None else line_width / 2
                cap_size = p.get("cs") if p.get("cs") is not None else 2
                cap_thick = p.get("ct") if p.get("ct") is not None else 1
                if y_dict_error.get(k) is not None:
                    axs.errorbar(
                        x_dict[k],
                        y_dict[k],
                        yerr=y_dict_error[k],
                        fmt=fmt,
                        lw=line_width,
                        ms=marker_size,
                        label=data_label,
                        color=line_color,
                        elinewidth=e_line_width,
                        capsize=cap_size,
                        capthick=cap_thick,
                    )
                else:
                    axs.plot(x_dict[k], y_dict[k], fmt, lw=line_width, ms=marker_size, label=data_label, color=line_color)
            else:
                if y_dict_error.get(k) is not None:
                    axs.errorbar(
                        x_dict[k],
                        y_dict[k],
                        yerr=y_dict_error[k],
                        label=k,
                        elinewidth=1,
                        capsize=2,
                        capthick=1,
                    )
                else:
                    axs.plot(
                        x_dict[k],
                        y_dict[k],
                        label=k,
                    )

    # - Legend
    legend_location = legend_loc if isinstance(legend_loc, (tuple, str)) else plt.rcParams["legend.loc"]
    framealpha = legend_transparent if isinstance(legend_transparent, float) else plt.rcParams["legend.framealpha"]
    legend_facecolor = legend_bg_color if legend_bg_color != "default" else None
    legend_edgecolor = legend_edge_color if legend_edge_color != "default" else None
    axs.legend(
        loc=legend_location,
        framealpha=framealpha,
        fancybox=True,
        facecolor=legend_facecolor,
        edgecolor=legend_edgecolor,
    )

    # - Title
    i0 = title_font_size if isinstance(title_font_size, int) else plt.rcParams["font.size"]
    f0 = title_v_offset if isinstance(title_v_offset, (int, float)) else plt.rcParams["axes.titlepad"]
    axs.set_title(title_name, pad=f0, fontsize=i0)

    # ========
    # 2. Axis
    # ========
    axs.grid(False)
    axs.minorticks_off()
    # -----------
    # 2.1 x-axis
    # -----------

    # - x Label
    axs.set_xlabel(x_label)

    # - x Grid
    if x_grid in ["major", "both"]:
        axs.grid(axis="x", which="major", color="#cccccc", linestyle="-")  # show x-axis grid
    if x_grid in ["minor", "both"]:
        axs.grid(axis="x", which="minor", color="#e7e7e7", linestyle="--")  # show x-axis sub-grid

    # - x Ticks
    axs.tick_params(axis="x", which="both", direction=x_ticks_direction)
    if x_scale == "linear":
        axs.set_xscale(x_scale)
        # -- Major ticks location
        if x_major_ticks_manual is None:
            if x_start_tick is None and x_end_tick is None:
                if isinstance(x_base, (float, int)):
                    axs.xaxis.set_major_locator(tck.MultipleLocator(base=float(x_base)))
                else:
                    axs.xaxis.set_major_locator(tck.MaxNLocator(nbins="auto"))
            else:
                if isinstance(x_base, (float, int)):
                    xstart, xend = axs.get_xlim()
                    if x_start_tick is not None:
                        xstart = x_start_tick if x_range != "auto" else x_range[0]
                    if x_end_tick is not None:
                        xend = x_end_tick if x_range != "auto" else x_range[1]
                    ticks = np.arange(xstart, xend, x_base)
                    axs.set_xticks(ticks)
                else:
                    axs.xaxis.set_major_locator(tck.MaxNLocator(nbins="auto"))

            # -- Major ticks label format
            mj_formatter = tck.ScalarFormatter()
            mj_formatter.set_scientific(True)  # Enable Scientific notation
            mj_formatter.set_powerlimits(plt.rcParams["axes.formatter.limits"])
            mj_formatter.set_useMathText(True)  # (False)1e8, (True)10^8
            axs.xaxis.set_major_formatter(mj_formatter)
        else:
            axs.set_xticks(x_major_ticks_manual[0])
            axs.xaxis.set_major_formatter(tck.FixedFormatter(x_major_ticks_manual[1]))

        # -- Minor ticks location
        if is_x_minor_ticks:
            axs.xaxis.set_minor_formatter(tck.NullFormatter())
            if x_minor_ticks_manual is None:
                axs.xaxis.set_minor_locator(tck.AutoMinorLocator(n=x_minor_division))
            else:
                axs.xaxis.set_minor_locator(tck.FixedLocator(x_minor_ticks_manual))

    elif x_scale == "log":
        axs.set_xscale(x_scale)
        x_log_base = x_base if isinstance(x_base, (float, int)) else 10.0

        if x_major_ticks_manual is None:
            # -- Major ticks location
            # Calc the position at integer power
            a_min_list = []
            a_max_list = []
            for k in x_dict.keys():
                a_min_list.append(np.amin(x_dict[k]))
                a_max_list.append(np.amax(x_dict[k]))
            a_min = np.amin(a_min_list)
            a_max = np.amin(a_max_list)
            n_power_min = np.floor(np.log(a_min) / np.log(x_log_base)).astype(int)
            n_power_max = np.ceil(np.log(a_max) / np.log(x_log_base)).astype(int)
            ticks = [x_log_base**i for i in range(n_power_min - 1, n_power_max + 2)]
            # Set the ticks location clearly
            axs.xaxis.set_major_locator(tck.FixedLocator(ticks))
            # -- Major ticks label format
            mj_formatter = tck.LogFormatterMathtext(base=x_log_base, labelOnlyBase=True)
            axs.xaxis.set_major_formatter(mj_formatter)
        else:
            axs.xaxis.set_major_locator(tck.FixedLocator(x_major_ticks_manual[0]))
            axs.xaxis.set_major_formatter(tck.FixedFormatter(x_major_ticks_manual[1]))

        # -- Minor ticks location
        if is_x_minor_ticks:
            axs.xaxis.set_minor_formatter(tck.NullFormatter())
            if x_minor_division is None:
                axs.xaxis.set_minor_locator(tck.LogLocator(base=x_log_base, subs=None))
            else:
                axs.xaxis.set_minor_locator(tck.LogLocator(base=x_log_base, subs=np.arange(1.0, x_minor_division, 1) * (1.0 / x_minor_division)))
    else:
        raise ValueError(f'x_scale must be "linear" or "log", your x_scale={x_scale}')

    # - x Range
    if isinstance(x_range, tuple):
        axs.set_xlim(x_range[0], x_range[1])
    else:
        axs.set_xlim(auto=True)

    if x_invert:
        axs.invert_xaxis()

    # -----------
    # 2.2 y-axis
    # -----------

    # - y Label
    axs.set_ylabel(y_label)

    # - y Grid
    if y_grid in ["major", "both"]:
        axs.grid(axis="y", which="major", color="#cccccc", linestyle="-")  # show y-axis grid
    if y_grid in ["minor", "both"]:
        axs.grid(axis="y", which="minor", color="#e7e7e7", linestyle="--")  # show y-axis sub-grid

    # - y Ticks
    axs.tick_params(axis="y", which="both", direction=y_ticks_direction)
    if y_scale == "linear":
        axs.set_yscale(y_scale)

        if y_major_ticks_manual is None:
            if y_start_tick is None and y_end_tick is None:
                if isinstance(y_base, (float, int)):
                    axs.yaxis.set_major_locator(tck.MultipleLocator(base=float(y_base)))
                else:
                    axs.yaxis.set_major_locator(tck.MaxNLocator(nbins="auto"))
            else:
                if isinstance(y_base, (float, int)):
                    # define ticks by start and interval
                    ystart, yend = axs.get_ylim()
                    if y_start_tick is not None:
                        ystart = y_start_tick if y_range != "auto" else y_range[0]
                    if y_end_tick is not None:
                        yend = y_end_tick if y_range != "auto" else y_range[1]
                    ticks = np.arange(ystart, yend, y_base)
                    axs.set_yticks(ticks)
                else:
                    axs.yaxis.set_major_locator(tck.MaxNLocator(nbins="auto"))
            # -- Major ticks label format
            mj_formatter = tck.ScalarFormatter()
            mj_formatter.set_scientific(True)  # Enable Scientific notation
            mj_formatter.set_powerlimits(plt.rcParams["axes.formatter.limits"])
            #   (set_powerlimits: Normal notation range, otherwise Scientific notation.)
            mj_formatter.set_useMathText(True)  # (False)1e8, (True)10^8
            axs.yaxis.set_major_formatter(mj_formatter)
        else:
            # axs.set_yticks(y_major_ticks_manual[0])
            axs.yaxis.set_major_locator(tck.FixedLocator(y_major_ticks_manual[0]))
            axs.yaxis.set_major_formatter(tck.FixedFormatter(y_major_ticks_manual[1]))

        # -- Minor ticks location
        if is_y_minor_ticks:
            axs.yaxis.set_minor_formatter(tck.NullFormatter())
            if y_minor_ticks_manual is None:
                axs.yaxis.set_minor_locator(tck.AutoMinorLocator(n=y_minor_division))
            else:
                axs.yaxis.set_minor_locator(tck.FixedLocator(y_minor_ticks_manual))

    elif y_scale == "log":
        axs.set_yscale(y_scale)
        y_log_base = y_base if isinstance(y_base, (float, int)) else 10.0

        if y_major_ticks_manual is None:
            # -- Major ticks location
            # Calc the position at integer power
            a_min_list = []
            a_max_list = []
            for k in y_dict.keys():
                a_min_list.append(np.amin(y_dict[k]))
                a_max_list.append(np.amax(y_dict[k]))
            a_min = np.amin(a_min_list)
            a_max = np.amin(a_max_list)
            n_power_min = np.floor(np.log(a_min) / np.log(y_log_base)).astype(int)
            n_power_max = np.ceil(np.log(a_max) / np.log(y_log_base)).astype(int)
            ticks = [y_log_base**i for i in range(n_power_min - 1, n_power_max + 2)]
            # Set the ticks location clearly
            axs.yaxis.set_major_locator(tck.FixedLocator(ticks))
            # -- Major ticks label format
            mj_formatter = tck.LogFormatterMathtext(base=y_log_base, labelOnlyBase=True)
            axs.yaxis.set_major_formatter(mj_formatter)
        else:
            axs.set_yticks(y_major_ticks_manual[0])
            axs.yaxis.set_major_formatter(tck.FixedFormatter(y_major_ticks_manual[1]))

        # -- Minor ticks location
        if is_y_minor_ticks:
            axs.yaxis.set_minor_formatter(tck.NullFormatter())
            if y_minor_division is None:
                axs.yaxis.set_minor_locator(tck.LogLocator(base=y_log_base, subs=None))
            else:
                axs.yaxis.set_minor_locator(tck.LogLocator(base=y_log_base, subs=np.arange(1.0, y_minor_division, 1) * (1.0 / y_minor_division)))
    else:
        raise ValueError(f'y_scale must be "linear" or "log", your y_scale={y_scale}')

    # - y Range
    if isinstance(y_range, tuple):
        axs.set_ylim(y_range[0], y_range[1])
    else:
        axs.set_ylim(auto=True)

    if y_invert:
        axs.invert_yaxis()
    # ==========
    # 3. Output
    # ==========
    # - Pop up GUI
    if show_gui:
        plt.show()

    # - output image
    if output_image_name is not None:
        if output_image_name.endswith(".eps"):
            # Don't plot the left-bottom region because the Bounding Box has negative value
            fig.subplots_adjust(left=0.3, right=0.9, bottom=0.3, top=0.9)
        # Save figure
        fig.savefig(output_image_name, dpi=400, bbox_inches="tight")
    plt.close()
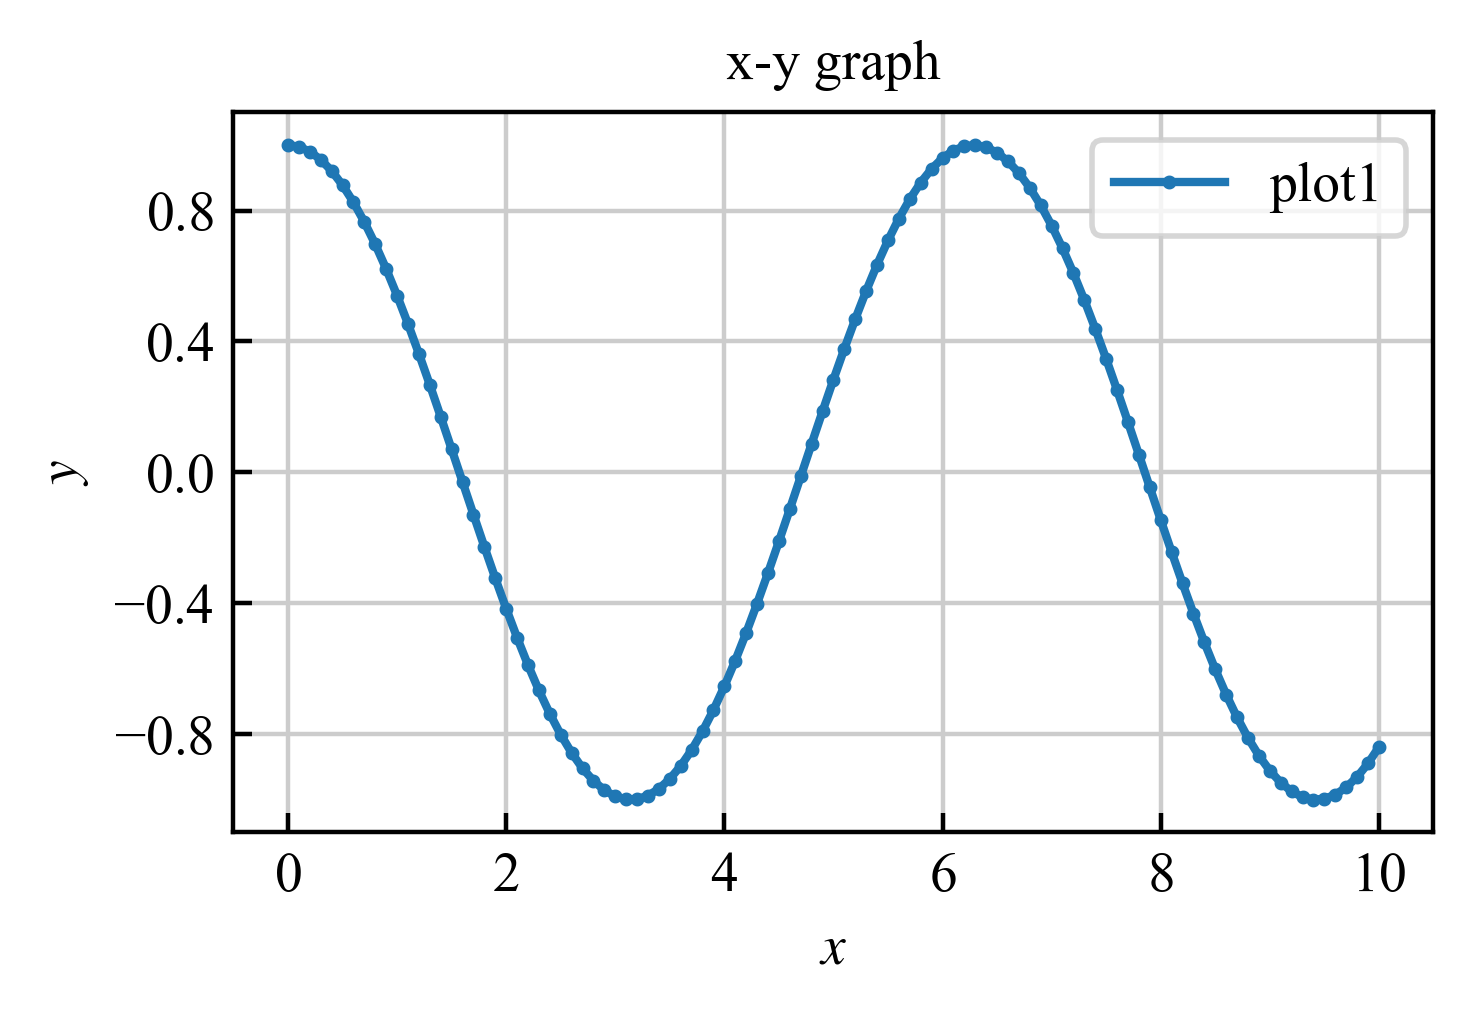
1.1. シンプルなプロットの場合 #
import numpy as np
from plot_xy import plot_xy

if __name__ == "__main__":
    x_arr = np.linspace(0.0, 10.0, 101)
    y_arr = np.cos(x_arr)

    x = {"plot1": x_arr}
    y = {"plot1": y_arr}
    output_name = "out1.png"

    plot_xy(x, y, output_image_name=output_name)
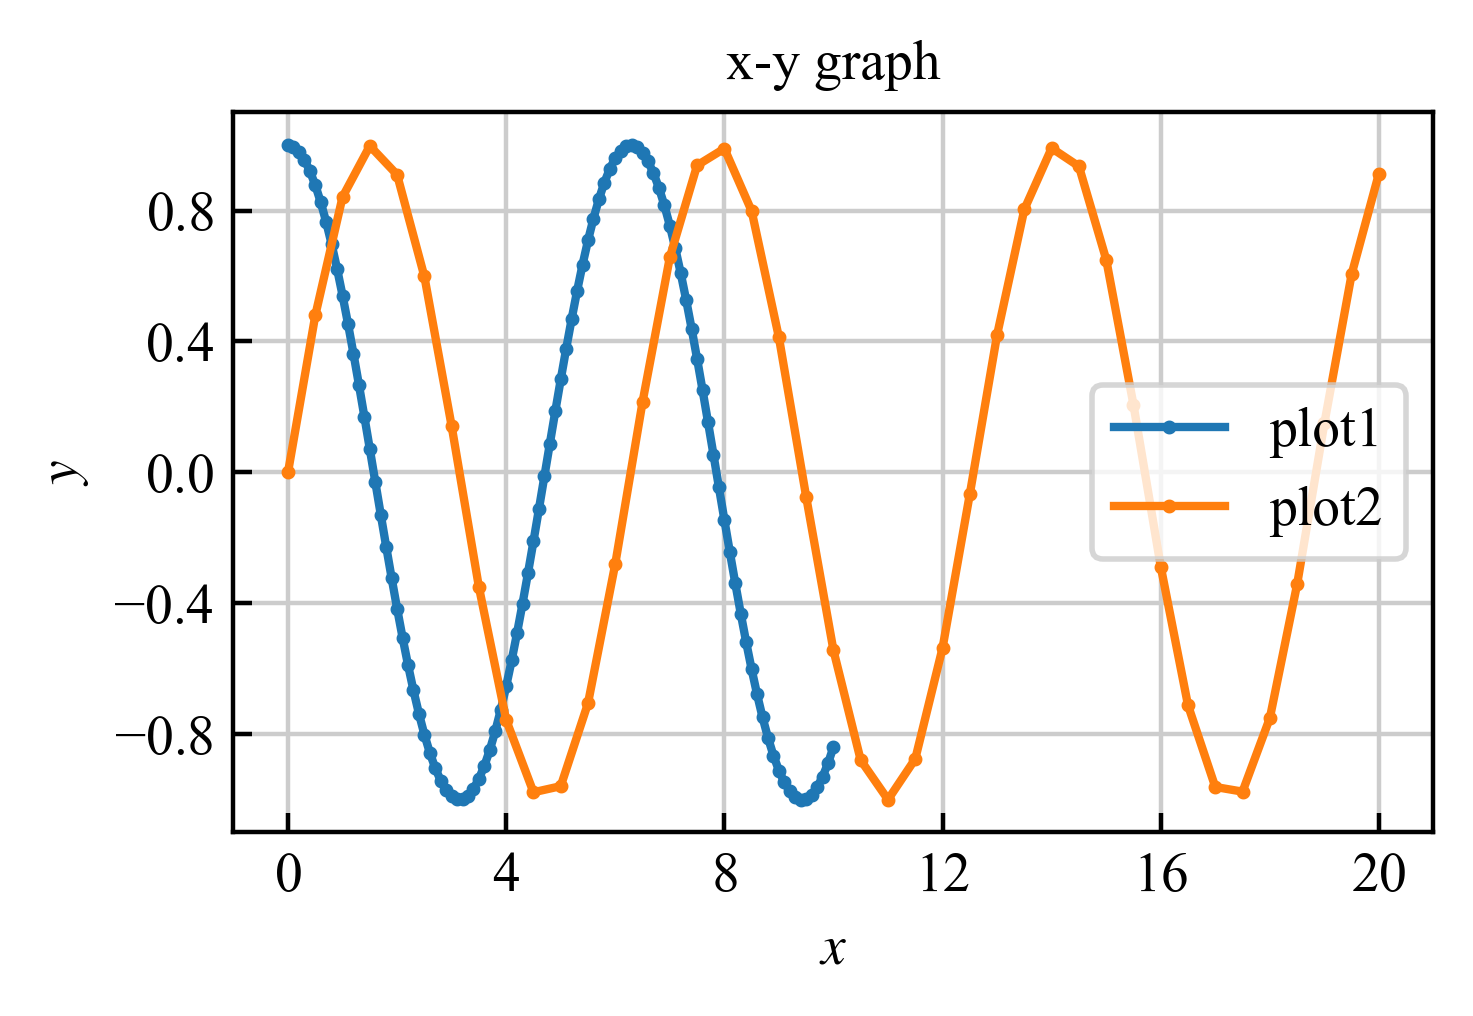
1.2. 複数のプロットを表示 #
import numpy as np
from plot_xy import plot_xy

if __name__ == "__main__":
    x1_arr = np.linspace(0.0, 10.0, 101)
    x2_arr = np.linspace(0.0, 20.0, 41)
    y1_arr = np.cos(x1_arr)
    y2_arr = np.sin(x2_arr)

    x = {"plot1": x1_arr, "plot2": x2_arr}
    y = {"plot1": y1_arr, "plot2": y2_arr}
    output_name = "out2.png"

    plot_xy(x, y, output_image_name=output_name)
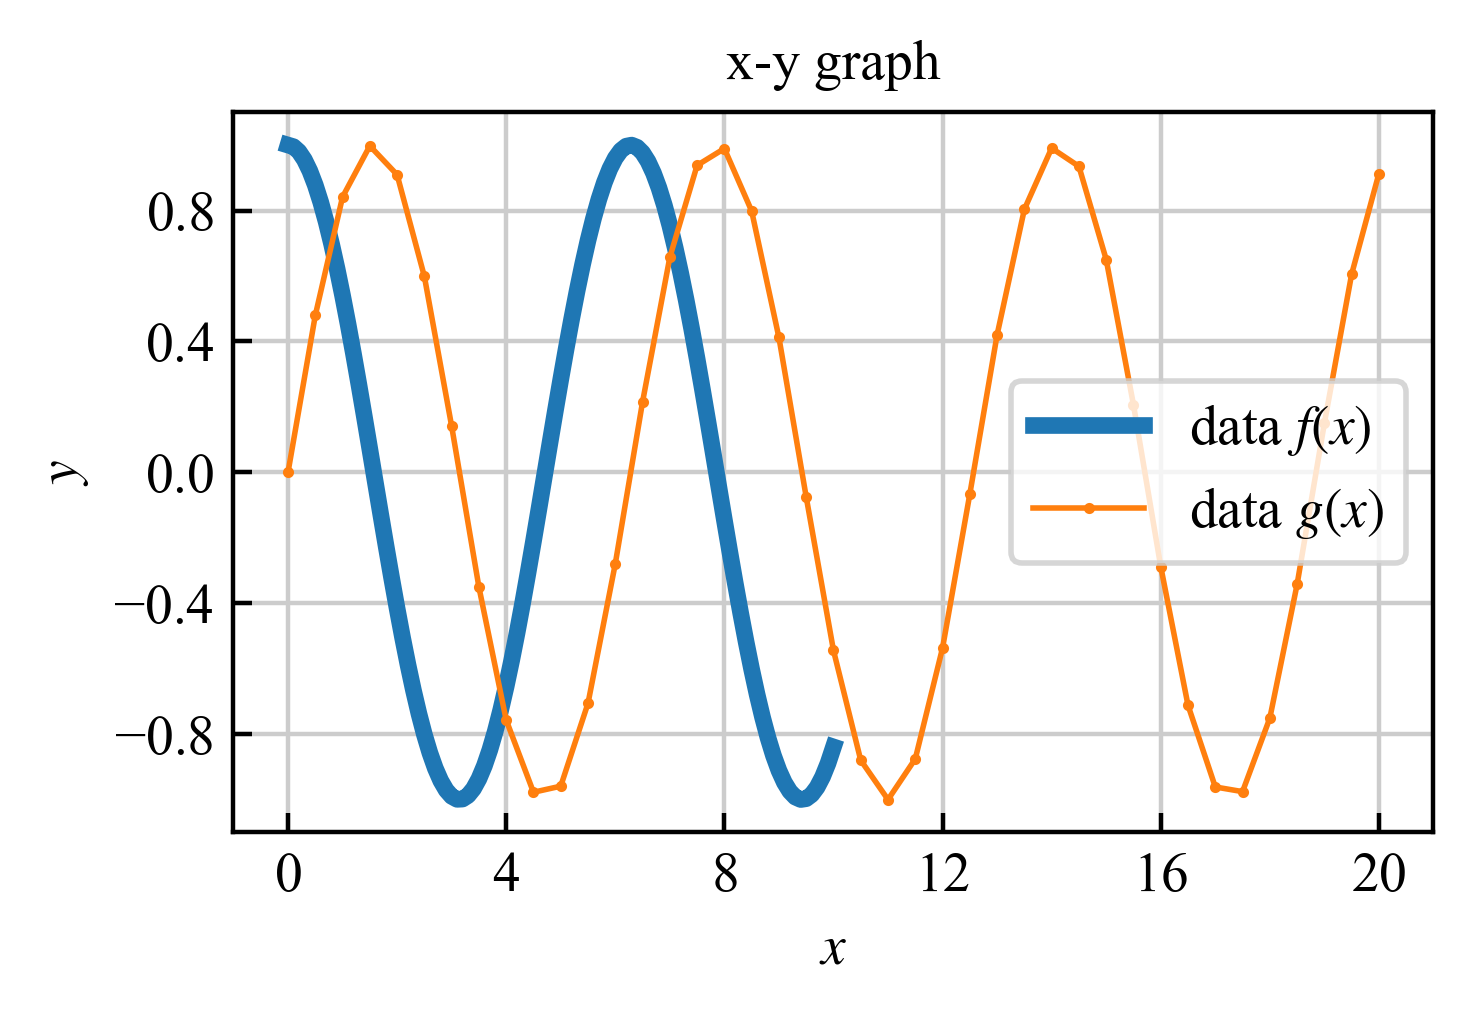
1.3. 線の色などを変更する #
import numpy as np
from plot_xy import plot_xy

if __name__ == "__main__":
    x1_arr = np.linspace(0.0, 10.0, 101)
    x2_arr = np.linspace(0.0, 20.0, 41)
    y1_arr = np.cos(x1_arr)
    y2_arr = np.sin(x2_arr)

    x = {"plot1": x1_arr, "plot2": x2_arr}
    y = {"plot1": y1_arr, "plot2": y2_arr}
    output_name = "out3.png"

    data_optional = {
        "plot1": {"ti": "data $f(x)$", "fmt": "-", "lw": 3, "ms": 4},
        "plot2": {"ti": "data $g(x)$", "fmt": ".-", "lw": 1, "ms": 2},
    }
    plot_xy(x, y, output_image_name=output_name, data_optional=data_optional)
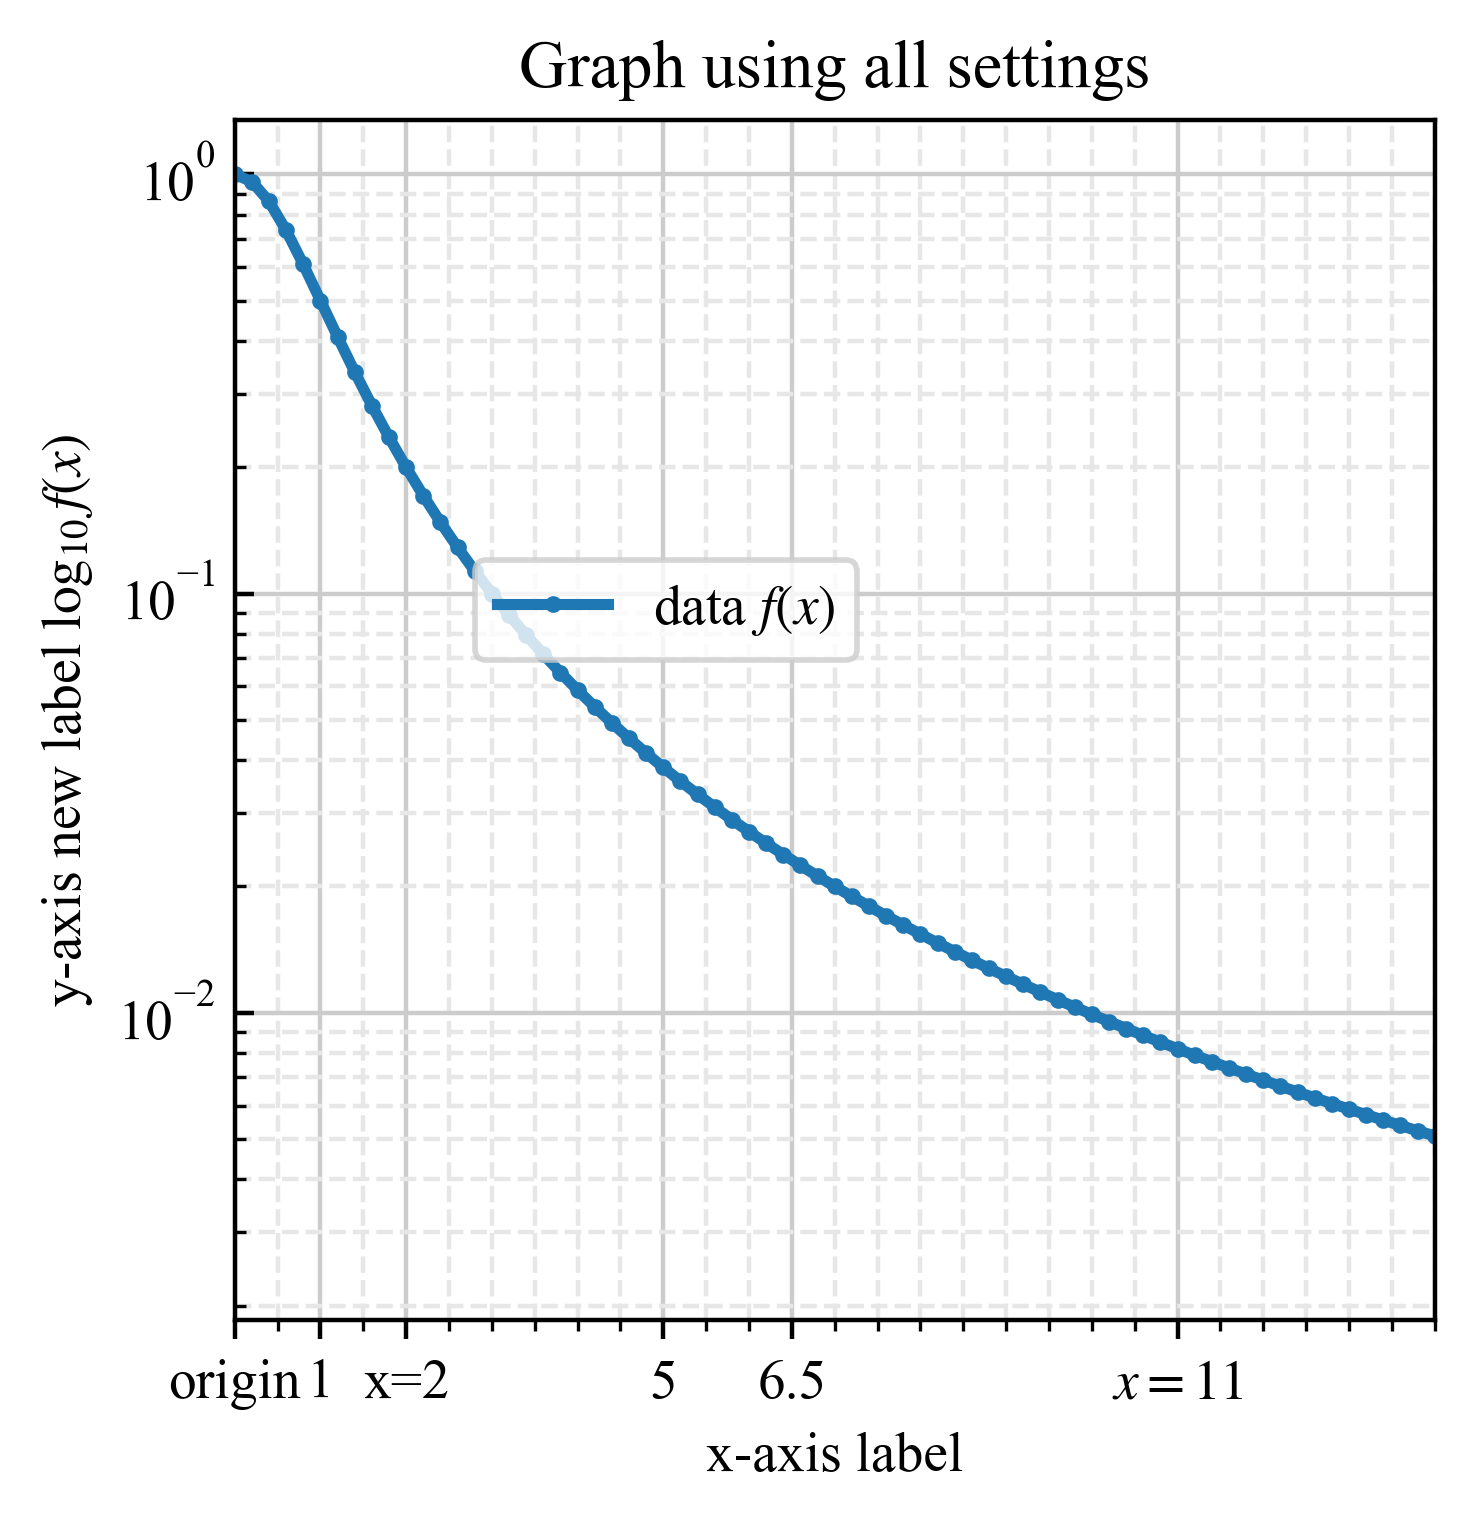
import numpy as np
from plot_xy import plot_xy

if __name__ == "__main__":
    x_arr = np.linspace(0.0, 20.0, 101)
    y_arr = 1 / (x_arr**2 + 1)

    x = {"plot1": x_arr}
    y = {"plot1": y_arr}
    output_name = "out4.png"

    data_optional = {"plot1": {"ti": "data $f(x)$", "fmt": ".-", "lw": 2, "ms": 4}}

    plot_xy(
        x,
        y,
        output_image_name=output_name,
        data_optional=data_optional,
        title_name="Graph using all settings",
        show_gui=True,  # True*, False
        title_font_size=12,  # (integer), "default"*
        title_v_offset="default",  # (float), "default"*
        figure_size=(5, 5),  # ((int), (int))
        x_scale="linear",  # "linear"*, "log"
        x_base=2,  # x_scale="linear": interval of major ticks, ="log": base of logarithrm
        x_range=(0.0, 14.0),  # ((range start),(range end)), "auto"*
        x_ticks_manual=([0, 1, 2, 5, 6.5, 11], ["origin", "1", "x=2", "5", "6.5", "$x=11$"]),  # , None*
        x_label="x-axis label",  # (string)
        x_grid="both",  # "minor", "major"*, "both"
        x_ticks_direction="out",  # "in"*, "out"
        is_x_minor_ticks=True,  # True, False*
        x_minor_division=2,  # Num. of divisions of x_base
        y_scale="log",
        y_base=10,
        y_range="auto",
        y_ticks_manual=None,
        y_label="y-axis new label $\log_{10}f(x)$",
        y_grid="both",
        y_ticks_direction="in",
        is_y_minor_ticks=True,
        y_minor_division=10,
        legend_loc=(0.2, 0.55),  # ((0.0-1.0), (0.0-1.0)), "default"*
    )
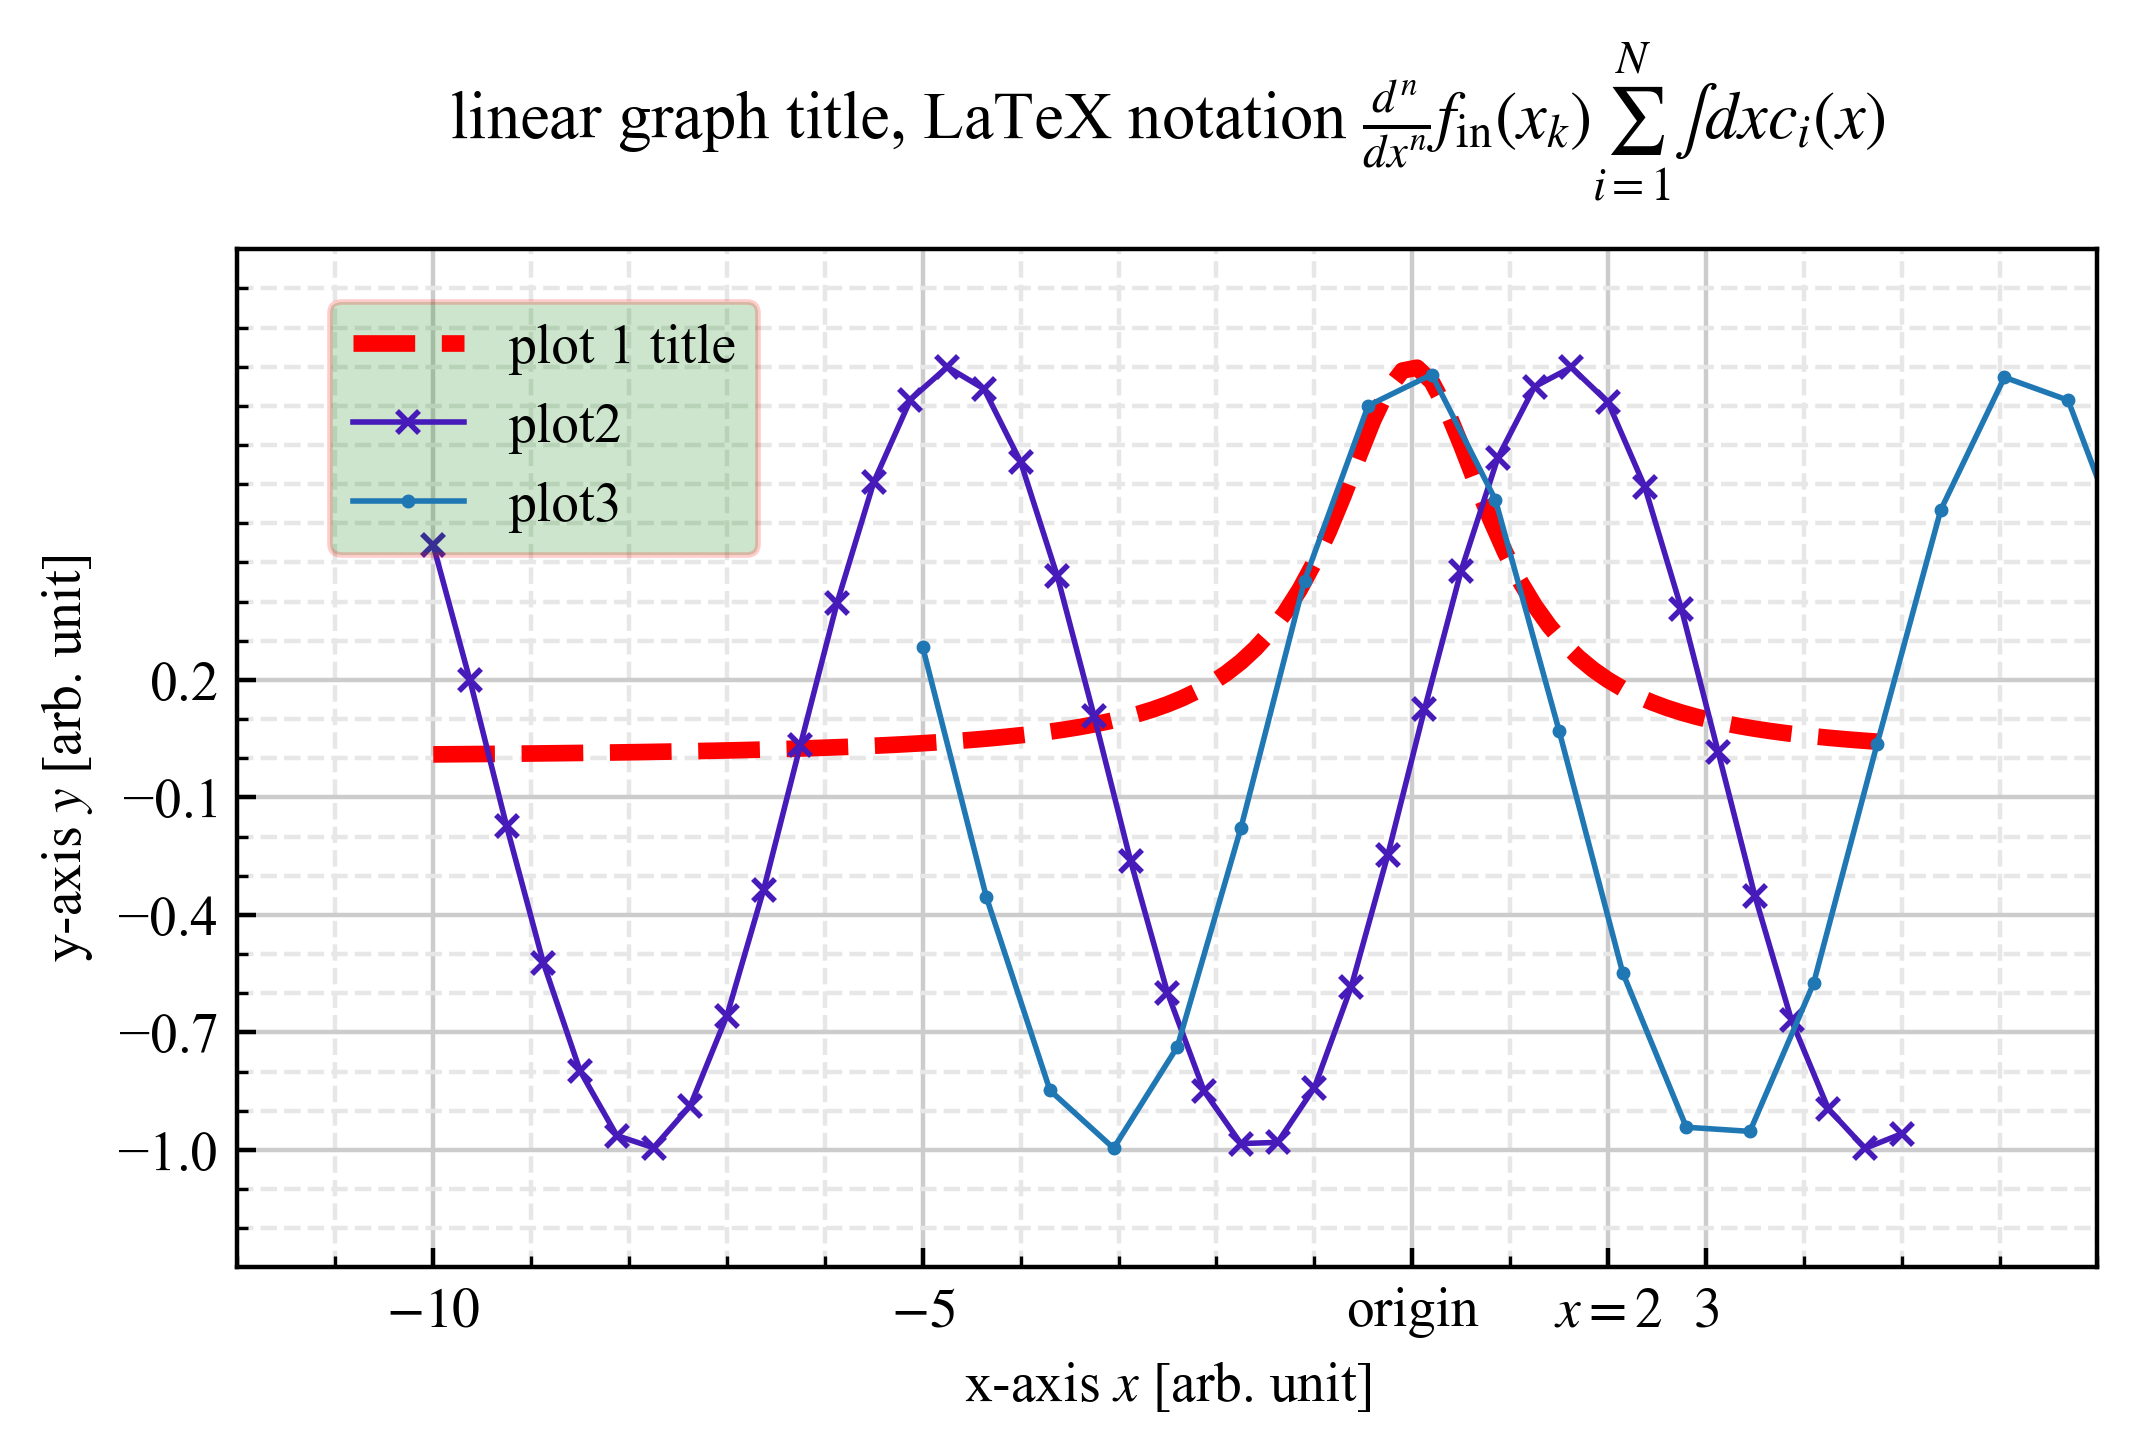
1.4. フォントの変更など #
import numpy as np
from plot_xy import plot_xy

if __name__ == "__main__":
    x1 = np.linspace(-10, 5, 101)
    x2 = np.linspace(-10, 5, 41)
    x3 = np.linspace(-5, 8, 21)
    y1 = 1.0 / (x1**2 + 1)
    y2 = np.sin(x2)
    y3 = np.cos(x3)

    # ------
    x = {"plot1": x1, "plot2": x2, "plot3": x3}
    y = {"plot1": y1, "plot2": y2, "plot3": y3}
    data_optional = {
        "plot1": {"fmt": "--", "ti": "plot 1 title", "lw": 3, "lc": "red"},
        "plot2": {"fmt": "x-", "ms": 4, "lc": "#471bb9"},
        "plot3": {},
    }

    output_image = "out_linear.png"
    x_major_ticks_manual = ([-10, -5, 0, 2, 3], ["$-10$", "$-5$", "origin", "$x=2$", "$3$"])
    x_minor_ticks_manual = np.arange(-14, 8, 1).tolist()
    plot_xy(
        x,
        y,
        output_image_name=output_image,
        show_gui=True,
        data_optional=data_optional,
        title_name=r"linear graph title, LaTeX notation $\frac{d^n}{dx^n}f_{\mathrm{in}}(x_k) \sum_{i=1}^N \int dx c_i(x)$",
        title_font_size=12,
        title_v_offset=20,
        figure_size=(6, 4),
        aspect_ratio=4,
        legend_loc=(0.05, 0.7),
        legend_transparent=0.2,
        legend_bg_color="green",
        legend_edge_color="red",
        x_scale="linear",
        # x_base=10,
        x_range=(-12.0, 7.0),
        # x_start_tick=5,
        # x_end_tick=3,
        x_major_ticks_manual=x_major_ticks_manual,
        x_label="x-axis $x$ [arb. unit]",
        x_grid="both",
        x_ticks_direction="in",
        is_x_minor_ticks=True,
        # x_minor_division=2,
        x_minor_ticks_manual=x_minor_ticks_manual,
        y_scale="linear",
        y_base=0.3,
        y_range=(-1.3, 1.3),
        y_start_tick=-1,
        y_end_tick=0.3,
        # y_major_ticks_manual=y_major_ticks_manual,
        y_label="y-axis $y$ [arb. unit]",
        y_grid="both",
        y_ticks_direction="in",
        is_y_minor_ticks=True,
        y_minor_division=3,
        # y_minor_ticks_manual=y_minor_ticks_manual,
    )
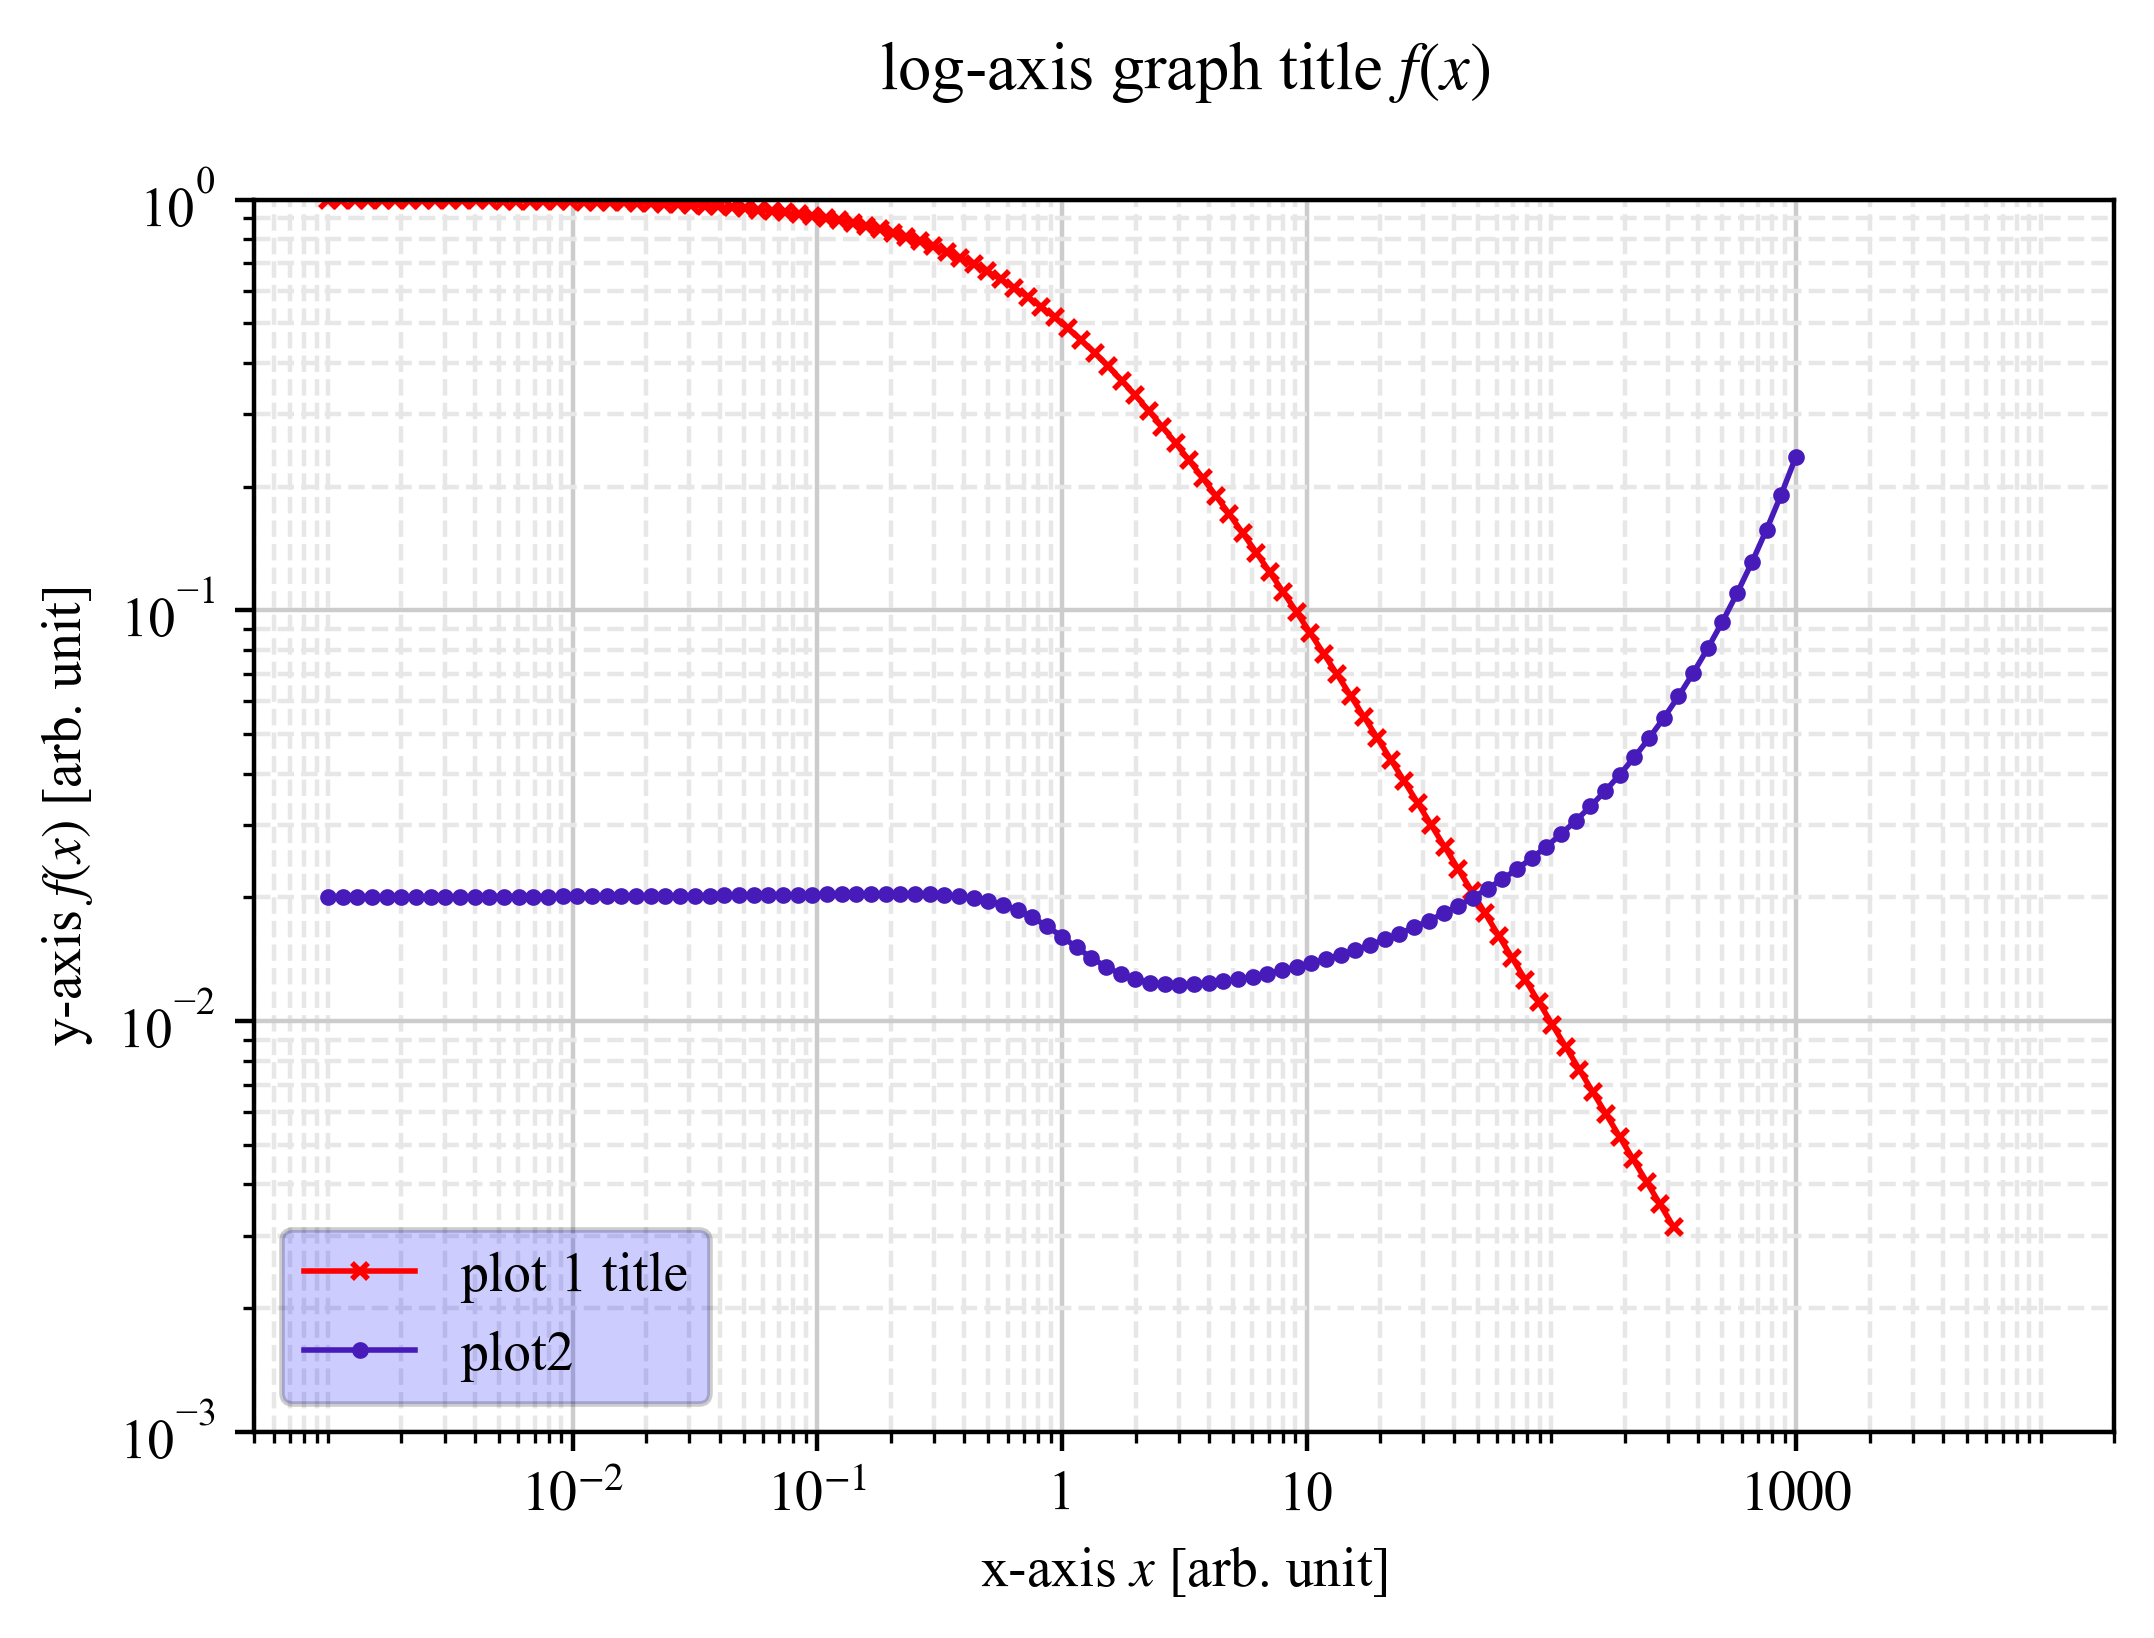
1.5. 対数プロット #
import numpy as np
from plot_xy import plot_xy

if __name__ == "__main__":
    x1 = np.logspace(-3, 2.5, 101)
    x2 = np.logspace(-3, 3, 101)
    y1 = 1.0 / (x1 + 1)
    y2 = 0.01 * (1.0 / (x2**3 + 1) + np.exp(0.1 * x2**0.5))

    # ------
    x = {"plot1": x1, "plot2": x2}
    y = {"plot1": y1, "plot2": y2}
    data_optional = {
        "plot1": {"fmt": "x-", "ti": "plot 1 title", "lw": 1, "lc": "red"},
        "plot2": {"fmt": ".-", "ms": 4, "lc": "#471bb9"},
    }

    output_image = "out_log.png"
    x_major_ticks_manual = ([1e-2, 1e-1, 1e0, 1e1, 1e3], ["$10^{-2}$", "$10^{-1}$", "1", "10", "$1000$"])
    plot_xy(
        x,
        y,
        output_image_name=output_image,
        show_gui=True,
        data_optional=data_optional,
        title_name="log-axis graph title $f(x)$",
        title_font_size=12,
        title_v_offset=20,
        figure_size=(6, 4),
        aspect_ratio="auto",
        legend_loc="lower left",  # (0.7, 0.2),
        legend_transparent=0.2,
        legend_bg_color="blue",
        legend_edge_color="black",
        x_scale="log",
        # x_base=10,
        x_range=(5e-4, 2e4),
        # x_start_tick=5,
        # x_end_tick=3,
        x_major_ticks_manual=x_major_ticks_manual,
        x_label="x-axis $x$ [arb. unit]",
        x_grid="both",
        x_ticks_direction="out",
        is_x_minor_ticks=True,
        x_minor_division=10,
        # x_minor_ticks_manual=x_minor_ticks_manual,
        y_scale="log",
        y_base=10,
        y_range=(1e-3, 1),
        y_start_tick=-1,
        y_end_tick=0.3,
        # y_major_ticks_manual=y_major_ticks_manual,
        y_label="y-axis $f(x)$ [arb. unit]",
        y_grid="both",
        y_ticks_direction="out",
        is_y_minor_ticks=True,
        y_minor_division=10,
        # y_minor_ticks_manual=y_minor_ticks_manual,
    )
2. $f(x,y)$をカラーマップとして出力・保存する関数 plot_fxy #
def plot_fxy
import numpy as np
import matplotlib.pyplot as plt
import matplotlib.ticker as tck
import matplotlib.colors as mcolors
import matplotlib.patches as mpatches

plt.rcParams["font.family"] = "Times New Roman"  # font
plt.rcParams["font.size"] = 10  # character size
plt.rcParams["mathtext.fontset"] = "stix"  # font Math

# plt.rcParams["axes.prop_cycle"] = plt.cycler(
#    color=["#000000", "#ff0000", "#0000ff", "#228b22", "#ff00ff", "#ffd900", "#00ffff", "#7f00ff", "#ff7f00", "#00ff7f", "#bebebe", "#666666"]
# )


def plot_color2d(
    x_mesh: np.ndarray,
    y_mesh: np.ndarray,
    z_mesh: np.ndarray,
    output_image_name: str = None,  # "out.png",
    show_gui: bool = True,
    title_name: str = "x-y graph",
    title_font_size: int | str = "default",
    title_v_offset: float | str = "default",
    figure_size: tuple[int, int] = (8, 5),
    aspect_ratio: str | float = "auto",
    legend_label: str | None = None,
    legend_loc: tuple[float, float] | str | None = None,  # "upper left",
    legend_transparent: float = 0.5,
    legend_bg_color: str = "default",
    legend_edge_color: str = "default",
    x_scale: str = "linear",
    x_base: float | int | str = "auto",
    x_start_tick: float = None,
    x_end_tick: float = None,
    x_range: tuple[float, float] | str = "auto",
    x_ticks_manual: tuple | None = None,
    x_label: str = "$x$",
    x_grid: str = "major",
    x_ticks_direction: str = "in",
    is_x_minor_ticks: bool = False,
    x_minor_ticks_manual: tuple | None = None,
    x_minor_division: int | None = None,
    x_invert: bool = False,
    y_scale: str = "linear",
    y_base: float | int | str = "auto",
    y_range: tuple[float, float] | str = "auto",
    y_start_tick: float = None,
    y_end_tick: float = None,
    y_ticks_manual: tuple | None = None,
    y_label: str = "$y$",
    y_grid: str = "major",
    y_ticks_direction: str = "in",
    is_y_minor_ticks: bool = False,
    y_minor_ticks_manual: tuple | None = None,
    y_minor_division: int | None = None,
    y_invert: bool = False,
    color_scale: str = "linear",
    color_range: tuple[float, float] | str = "auto",
    color_map_name: tuple[float, float] | str = "viridis",
    color_transparent: float = 1.0,
    color_bar_label: str = "$z$",
    color_ticks_manual: tuple | None = None,
    default_font_family: str = "Times New Roman",
    default_font_size: int = 10,
    default_font_set: str = "stix",
) -> None:
    plt.rcdefaults()

    plt.rcParams["font.family"] = default_font_family  # font
    plt.rcParams["font.size"] = default_font_size  # character size
    plt.rcParams["mathtext.fontset"] = default_font_set  # font Math

    # ===================
    # 1. Global settings
    # ===================

    # - Make figure and subplots
    fig, axs = plt.subplots(1, 1, figsize=figure_size)

    # - Aspect ratio
    axs.set_aspect(aspect_ratio, adjustable="box")

    # - Color range
    if color_scale == "linear":
        norm = None
        if color_range != "auto":
            norm = mcolors.Normalize(vmin=color_range[0], vmax=color_range[1])
    else:
        # color_scale == "log"
        norm = mcolors.LogNorm()
        if color_range != "auto":
            norm = mcolors.LogNorm(vmin=color_range[0], vmax=color_range[1])

    c = axs.pcolormesh(
        x_mesh,
        y_mesh,
        z_mesh,
        shading="auto",
        norm=norm,
        cmap=color_map_name,
        alpha=color_transparent,
    )

    # - Title
    i0 = (
        title_font_size
        if isinstance(title_font_size, int)
        else plt.rcParams["font.size"]
    )
    f0 = (
        title_v_offset
        if isinstance(title_v_offset, float)
        else plt.rcParams["axes.titlepad"]
    )
    axs.set_title(title_name, pad=f0, fontsize=i0)

    # ========
    # 2. Axis
    # ========
    axs.grid(False)
    axs.minorticks_off()
    # -----------
    # 2.1 x-axis
    # -----------

    # - x Label
    if x_label is not None:
        axs.set_xlabel(x_label)

    # - x Grid
    if x_grid in ["major", "both"]:
        axs.grid(
            axis="x", which="major", color="#cccccc", linestyle="--", linewidth=1
        )  # show x-axis grid
    if x_grid in ["minor", "both"]:
        axs.grid(
            axis="x", which="minor", color="#e7e7e7", linestyle="--", linewidth=0.5
        )  # show x-axis sub-grid

    # - x Ticks
    axs.tick_params(axis="x", which="both", direction=x_ticks_direction)
    if x_scale == "linear":
        axs.set_xscale(x_scale)
        # -- Major ticks location
        if x_ticks_manual is None:
            if x_start_tick is None or x_end_tick is None:
                if isinstance(x_base, (float, int)):
                    axs.xaxis.set_major_locator(tck.MultipleLocator(base=float(x_base)))
                else:
                    axs.xaxis.set_major_locator(tck.MaxNLocator(nbins="auto"))
            else:
                if isinstance(x_base, (float, int)):
                    # define ticks by start and interval
                    xstart, xend = axs.get_xlim()
                    if x_start_tick is not None:
                        xstart = x_start_tick if x_range != "auto" else x_range[0]
                    if x_end_tick is not None:
                        xend = x_end_tick if x_range != "auto" else x_range[1]
                    ticks = np.arange(xstart, xend, x_base)
                    axs.set_xticks(ticks)
                else:
                    axs.xaxis.set_major_locator(tck.MaxNLocator(nbins="auto"))

            # -- Major ticks label format
            mj_formatter = tck.ScalarFormatter()
            mj_formatter.set_scientific(True)  # Enable Scientific notation
            mj_formatter.set_powerlimits(plt.rcParams["axes.formatter.limits"])
            #   (set_powerlimits: Normal notation range, otherwise Scientific notation.)
            mj_formatter.set_useMathText(True)  # (False)1e8, (True)10^8
            axs.xaxis.set_major_formatter(mj_formatter)
        else:
            axs.set_xticks(x_ticks_manual[0])
            axs.xaxis.set_major_formatter(tck.FixedFormatter(x_ticks_manual[1]))

        # -- Minor ticks location
        if is_x_minor_ticks:
            axs.xaxis.set_minor_formatter(tck.NullFormatter())
            if x_minor_ticks_manual is None:
                axs.xaxis.set_minor_locator(tck.AutoMinorLocator(n=x_minor_division))
            else:
                axs.xaxis.set_minor_locator(tck.FixedLocator(x_minor_ticks_manual))

    elif x_scale == "log":
        axs.set_xscale(x_scale)
        x_log_base = x_base if isinstance(x_base, (float, int)) else 10.0

        if x_ticks_manual is None:
            # -- Major ticks location
            # Calc the position at integer power
            a_min_list = []
            a_max_list = []
            a_min_list.append(np.amin(x_mesh))
            a_max_list.append(np.amax(x_mesh))
            a_min = np.amin(a_min_list)
            a_max = np.amin(a_max_list)
            n_power_min = np.floor(np.log(a_min) / np.log(x_log_base)).astype(int)
            n_power_max = np.ceil(np.log(a_max) / np.log(x_log_base)).astype(int)
            ticks = [x_log_base**i for i in range(n_power_min - 1, n_power_max + 2)]
            # Set the ticks location clearly
            axs.xaxis.set_major_locator(tck.FixedLocator(ticks))
            # -- Major ticks label format
            mj_formatter = tck.LogFormatterMathtext(base=x_log_base, labelOnlyBase=True)
            axs.xaxis.set_major_formatter(mj_formatter)
        else:
            # axs.set_xticks(x_ticks_manual[0])
            axs.xaxis.set_major_locator(tck.FixedLocator(x_ticks_manual[0]))
            axs.xaxis.set_major_formatter(tck.FixedFormatter(x_ticks_manual[1]))

        # -- Minor ticks location
        if is_x_minor_ticks:
            if x_minor_division is None:
                axs.xaxis.set_minor_locator(tck.LogLocator(base=x_log_base, subs=None))
            else:
                axs.xaxis.set_minor_locator(
                    tck.LogLocator(
                        base=x_log_base,
                        subs=np.arange(1.0, x_minor_division, 1)
                        * (1.0 / x_minor_division),
                    )
                )

    else:
        raise ValueError(f'x_scale must be "linear" or "log", your x_scale={x_scale}')

    # - x Range
    if isinstance(x_range, tuple):
        axs.set_xlim(x_range[0], x_range[1])
    else:
        axs.set_xlim(auto=True)

    if x_invert:
        axs.invert_xaxis()

    # -----------
    # 2.2 y-axis
    # -----------

    # - y Label
    if y_label is not None:
        axs.set_ylabel(y_label)

    # - y Grid
    if y_grid in ["major", "both"]:
        axs.grid(
            axis="y", which="major", color="#cccccc", linestyle="--", linewidth="1"
        )  # show y-axis grid
    if y_grid in ["minor", "both"]:
        axs.grid(
            axis="y", which="minor", color="#e7e7e7", linestyle="--", linewidth="0.5"
        )  # show y-axis sub-grid

    # - y Ticks
    axs.tick_params(axis="y", which="both", direction=y_ticks_direction)
    if y_scale == "linear":
        axs.set_yscale(y_scale)

        if y_ticks_manual is None:
            if y_start_tick is None or y_end_tick is None:
                if isinstance(y_base, (float, int)):
                    axs.yaxis.set_major_locator(tck.MultipleLocator(base=float(y_base)))
                else:
                    axs.yaxis.set_major_locator(tck.MaxNLocator(nbins="auto"))
            else:
                if isinstance(y_base, (float, int)):
                    # define ticks by start and interval
                    ystart, yend = axs.get_ylim()
                    if y_start_tick is not None:
                        ystart = y_start_tick if y_range != "auto" else y_range[0]
                    if y_end_tick is not None:
                        yend = y_end_tick if y_range != "auto" else y_range[1]
                    ticks = np.arange(ystart, yend, y_base)
                    axs.set_yticks(ticks)
                else:
                    axs.yaxis.set_major_locator(tck.MaxNLocator(nbins="auto"))
            # -- Major ticks label format
            mj_formatter = tck.ScalarFormatter()
            mj_formatter.set_scientific(True)  # Enable Scientific notation
            mj_formatter.set_powerlimits(plt.rcParams["axes.formatter.limits"])
            #   (set_powerlimits: Normal notation range, otherwise Scientific notation.)
            mj_formatter.set_useMathText(True)  # (False)1e8, (True)10^8
            axs.yaxis.set_major_formatter(mj_formatter)
        else:
            axs.yaxis.set_major_locator(tck.FixedLocator(y_ticks_manual[0]))
            axs.yaxis.set_major_formatter(tck.FixedFormatter(y_ticks_manual[1]))

        # -- Minor ticks location
        if is_y_minor_ticks:
            axs.yaxis.set_minor_formatter(tck.NullFormatter())
            if y_minor_ticks_manual is None:
                axs.yaxis.set_minor_locator(tck.AutoMinorLocator(n=y_minor_division))
            else:
                axs.yaxis.set_minor_locator(tck.FixedLocator(y_minor_ticks_manual))

    elif y_scale == "log":
        axs.set_yscale(y_scale)
        y_log_base = y_base if isinstance(y_base, (float, int)) else 10.0

        if y_ticks_manual is None:
            # -- Major ticks location
            # Calc the position at integer power
            a_min_list = []
            a_max_list = []
            a_min_list.append(np.amin(y_mesh))
            a_max_list.append(np.amax(y_mesh))
            a_min = np.amin(a_min_list)
            a_max = np.amin(a_max_list)
            n_power_min = np.floor(np.log(a_min) / np.log(y_log_base)).astype(int)
            n_power_max = np.ceil(np.log(a_max) / np.log(y_log_base)).astype(int)
            ticks = [y_log_base**i for i in range(n_power_min - 1, n_power_max + 2)]
            # Set the ticks location clearly
            axs.yaxis.set_major_locator(tck.FixedLocator(ticks))
            # -- Major ticks label format
            mj_formatter = tck.LogFormatterMathtext(base=y_log_base, labelOnlyBase=True)
            axs.yaxis.set_major_formatter(mj_formatter)
        else:
            axs.set_yticks(y_ticks_manual[0])
            axs.yaxis.set_major_formatter(tck.FixedFormatter(y_ticks_manual[1]))

        # -- Minor ticks location
        if is_y_minor_ticks:
            axs.yaxis.set_minor_formatter(tck.NullFormatter())
            if y_minor_division is None:
                axs.yaxis.set_minor_locator(tck.LogLocator(base=y_log_base, subs=None))
            else:
                axs.yaxis.set_minor_locator(
                    tck.LogLocator(
                        base=y_log_base,
                        subs=np.arange(1.0, y_minor_division, 1)
                        * (1.0 / y_minor_division),
                    )
                )
    else:
        raise ValueError(f'y_scale must be "linear" or "log", your y_scale={y_scale}')

    # - y Range
    if isinstance(y_range, tuple):
        axs.set_ylim(y_range[0], y_range[1])
    else:
        axs.set_ylim(auto=True)

    if y_invert:
        axs.invert_yaxis()

    # ==============
    # 3. Color axis
    # ==============

    # - Color bar
    cbar = fig.colorbar(c, ax=axs, label=color_bar_label)

    if color_ticks_manual is not None:
        cbar.set_ticks(color_ticks_manual[0])
        cbar.set_ticklabels(color_ticks_manual[1])

    # - Legend position
    if legend_label is not None:
        patch = mpatches.Patch(label=legend_label)
        # - transparent legend background
        framealpha = (
            legend_transparent
            if isinstance(legend_transparent, float)
            else plt.rcParams["legend.framealpha"]
        )

        legend_facecolor = legend_bg_color if legend_bg_color != "default" else None
        legend_edgecolor = legend_edge_color if legend_edge_color != "default" else None
        plt.legend(
            handles=[patch],
            loc=legend_loc,
            handlelength=0,
            handletextpad=0,
            framealpha=framealpha,
            fancybox=False,
            facecolor=legend_facecolor,
            edgecolor=legend_edgecolor,
        )

    # ==========
    # 3. Output
    # ==========
    # - Pop up GUI
    if show_gui:
        plt.show()

    # - output image
    if output_image_name is not None:
        if output_image_name.endswith(".eps"):
            # Don't plot the left-bottom region because the Bounding Box has negative value
            fig.subplots_adjust(left=0.3, right=0.9, bottom=0.3, top=0.9)
        # Save figure
        fig.savefig(output_image_name, dpi=400, bbox_inches="tight")

    plt.cla()
    plt.clf()
    plt.close()
2.1. 要素数の注意 #
座標軸の要素数の違いによって、z軸成分の示す範囲が変わります。
本稿ではmatplotlib.pyplot.pcolormeshのオプションをshading='auto'に固定しています。
そのため、x,y軸の要素数が異なることによってその点を中心に色を付けるか、囲まれた領域の左下の点を基準に色を示すかが変わります。
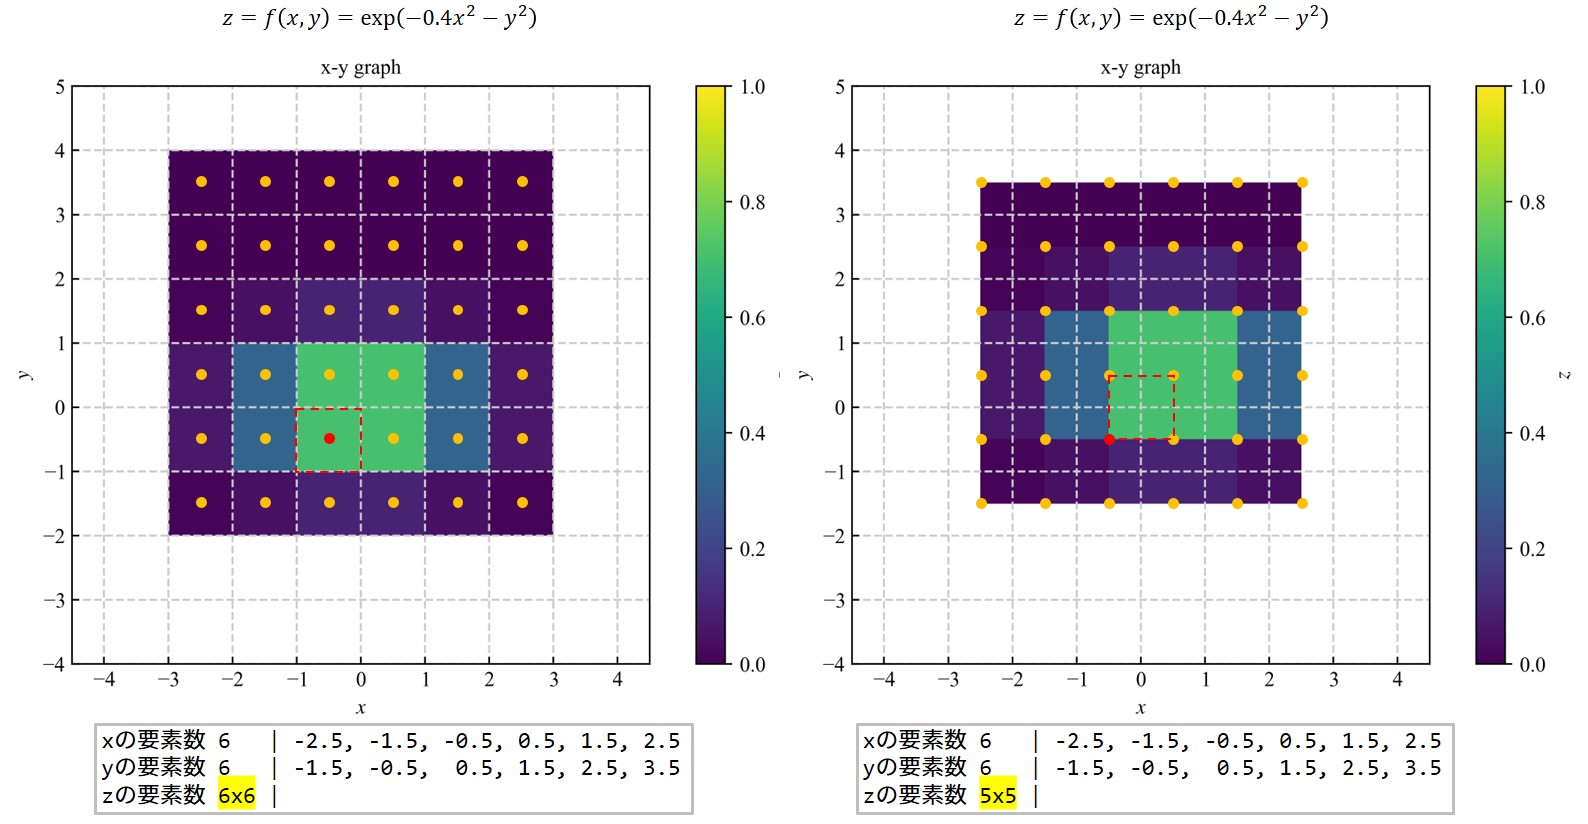
詳細は、下記の公式ページをご覧ください。 pcolormesh grids and shading -matplotlib
2.2. 使用例 #
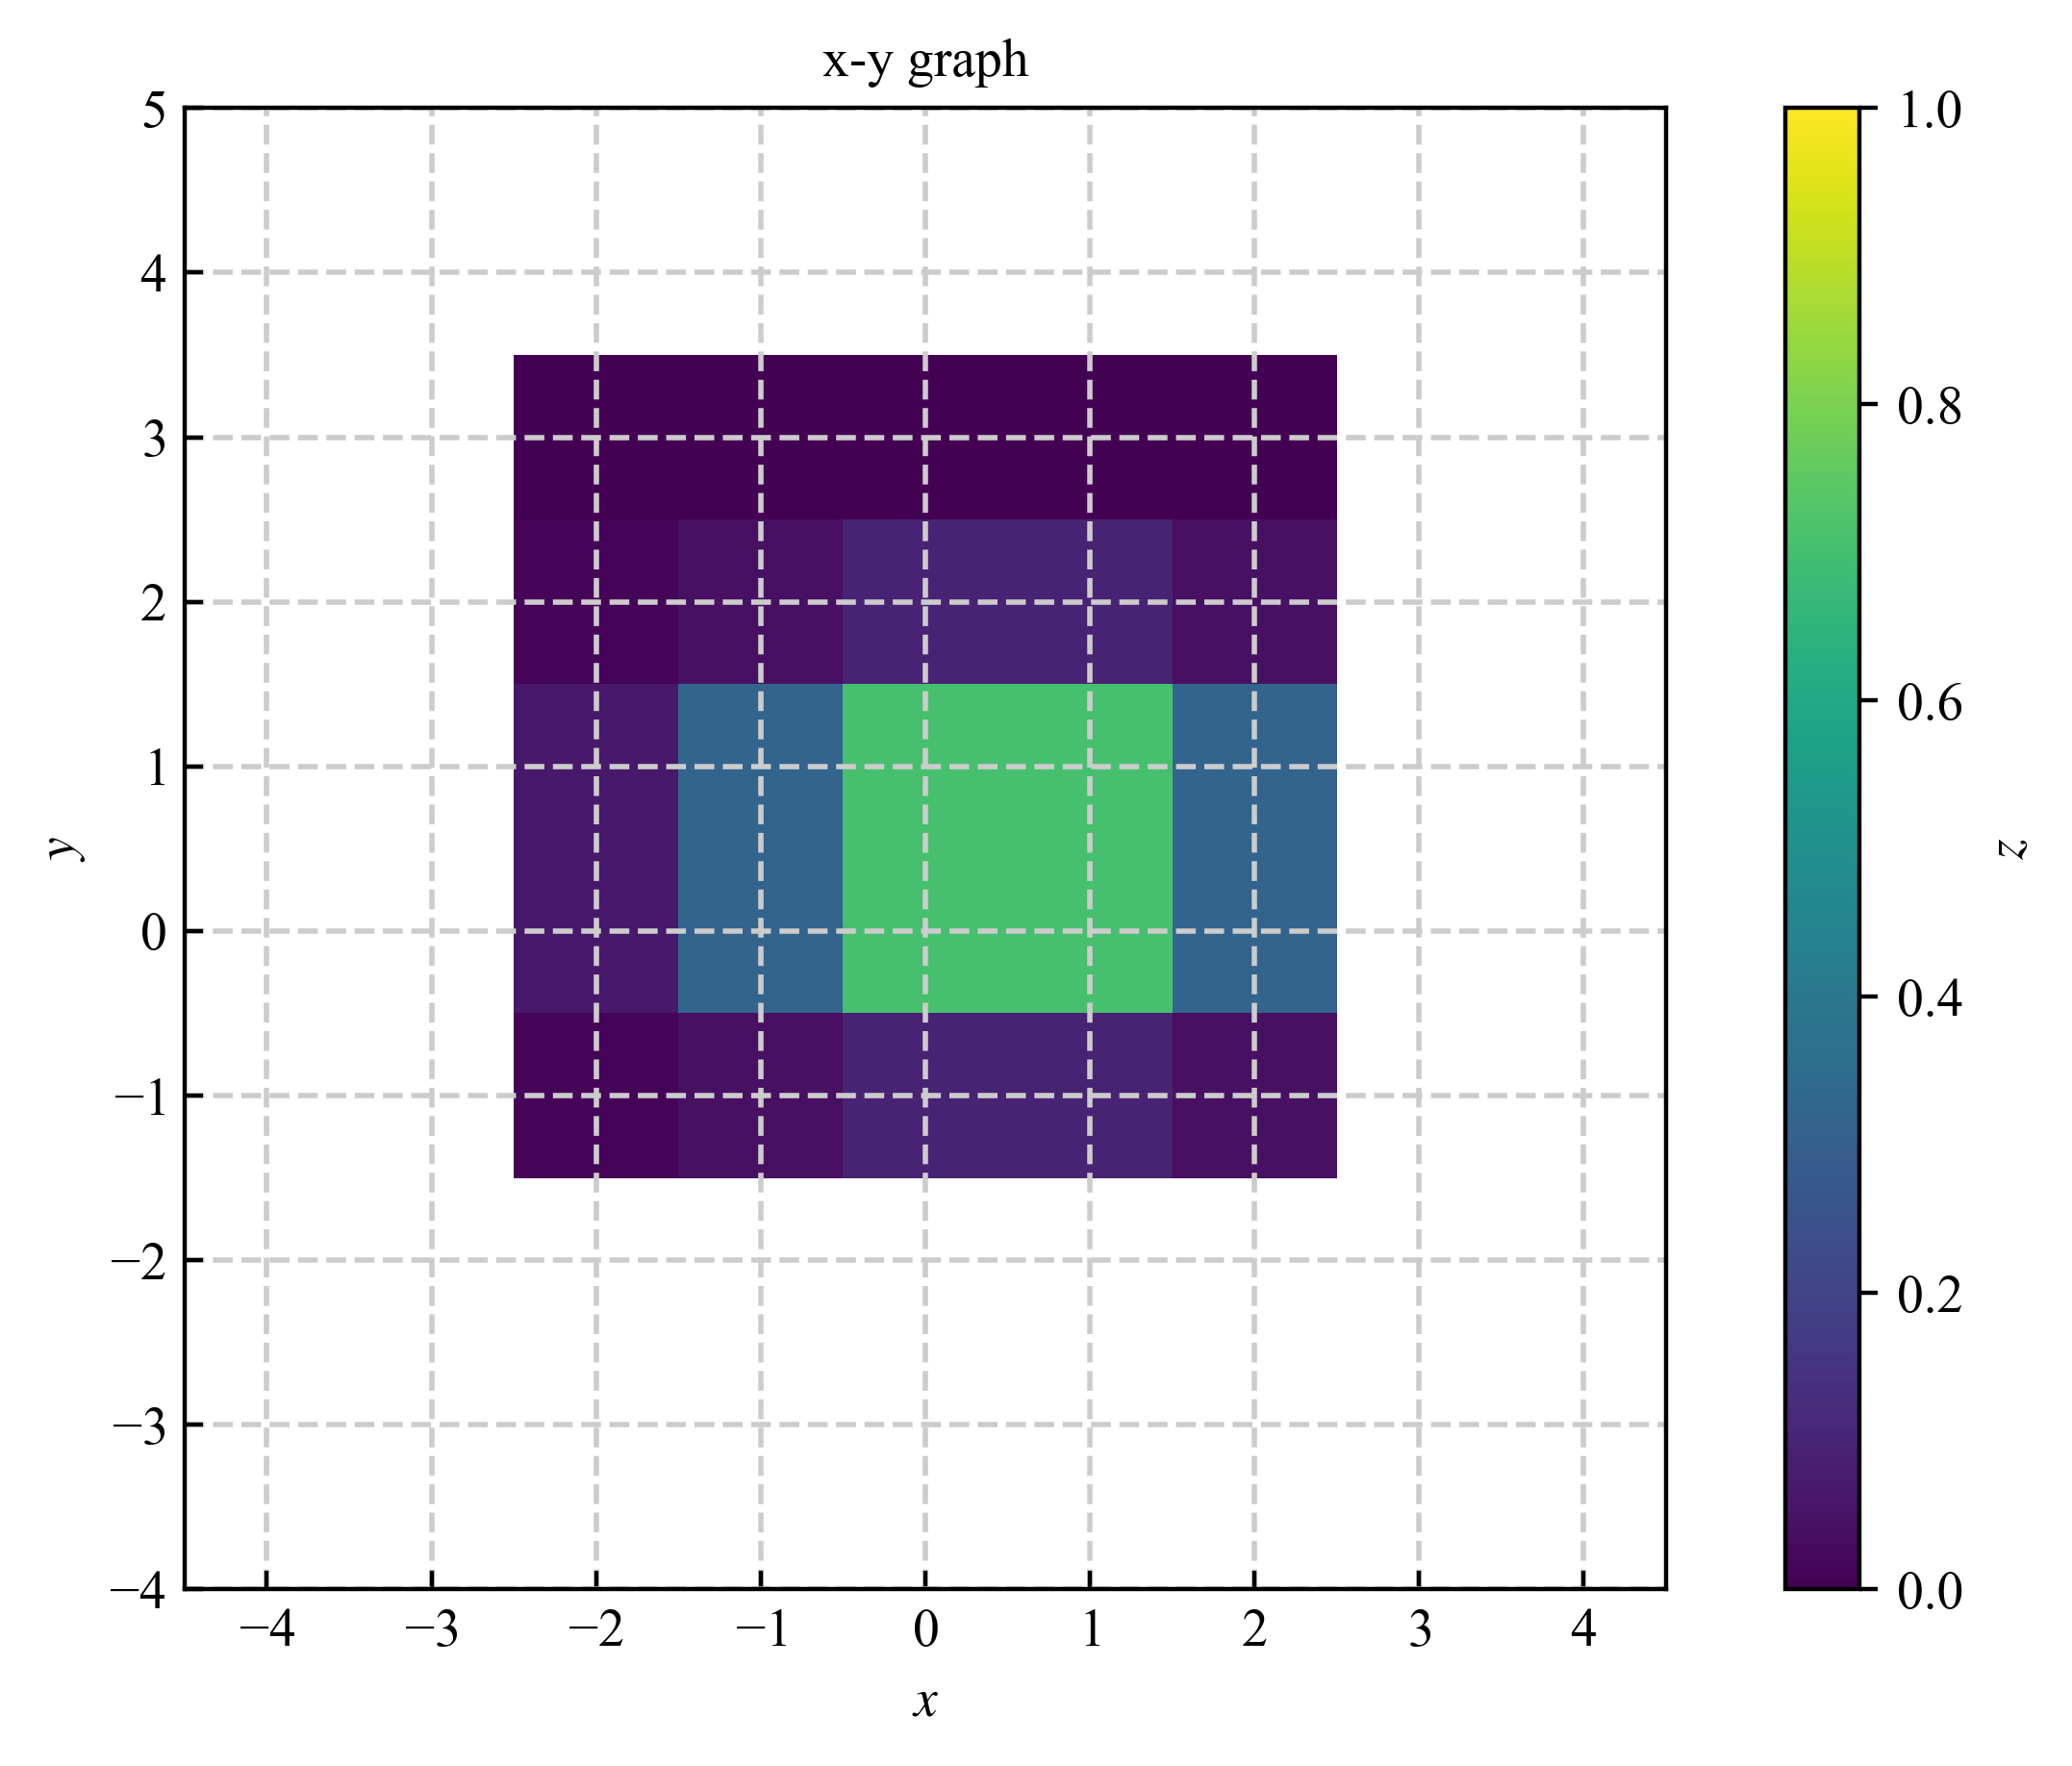
2.2.1. 与えられた点を中心にカラーを表現 #
- x軸の要素数 $N$
- y軸の要素数 $N$
- z軸の要素数 $N$
import numpy as np
from plot_fxy import plot_color2d


if __name__ == "__main__":
    Nx = 6
    Ny = 6
    x_arr = np.linspace(-2.5, 2.5, Nx)
    y_arr = np.linspace(-1.5, 3.5, Ny)
    x, y = np.meshgrid(x_arr, y_arr)
    z = np.exp(-0.4 * (x - 0) ** 2) * np.exp(-1 * (y - 0) ** 2)

    # z = z[:-1, :-1]
    print(f"x | {x_arr}") # x | [-2.5 -1.5 -0.5  0.5  1.5  2.5]
    print(f"y | {y_arr}") # y | [-1.5 -0.5  0.5  1.5  2.5  3.5]
    print(f"x size = {x.shape[0]}, {x.shape[1]}") # x size = 6, 6
    print(f"y size = {y.shape[0]}, {y.shape[1]}") # y size = 6, 6
    print(f"z size = {z.shape[0]}, {z.shape[1]}") # z size = 6, 6

    plot_color2d(
        x,
        y,
        z,
        show_gui=True,
        output_image_name="out_center.png",
        aspect_ratio="equal",
        x_range=(-4.5, 4.5),
        x_grid="both",
        y_range=(-4, 5),
        y_grid="both",
        color_range=(0, 1),
    )
生成される画像
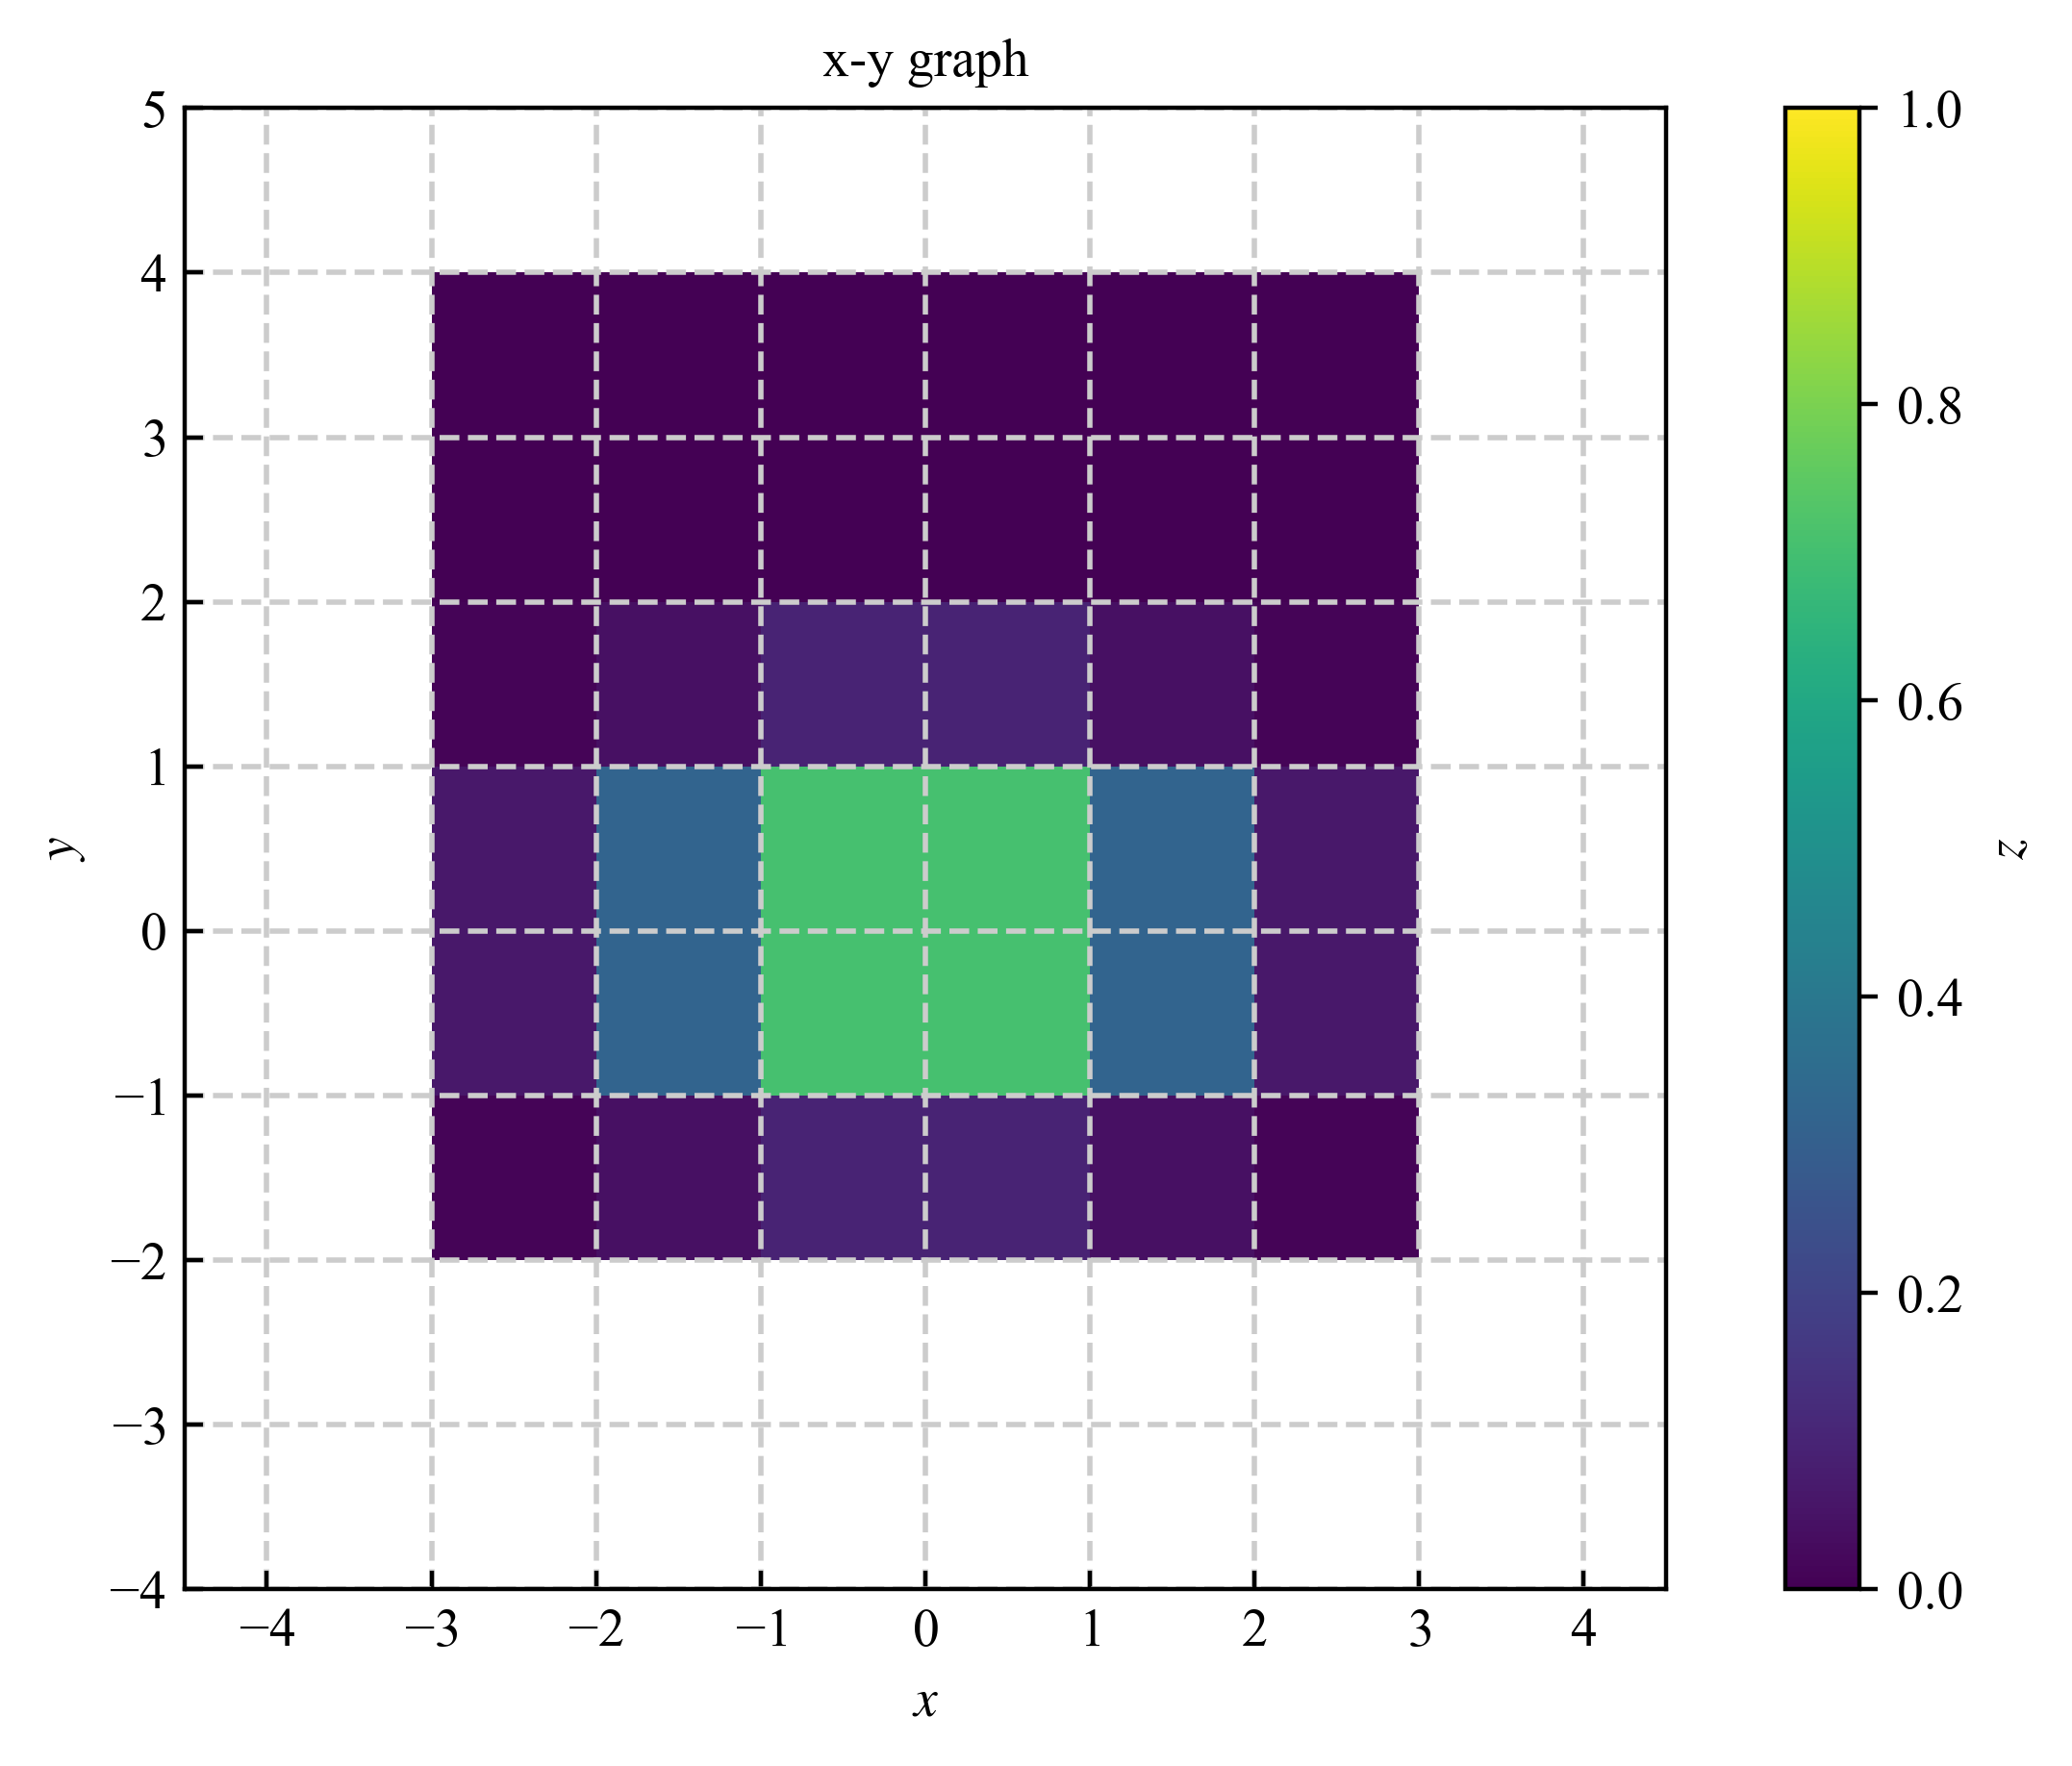
2.2.2. 囲まれた領域と値を指定して表現 #
- x軸の要素数 $N+1$
- y軸の要素数 $N+1$
- z軸の要素数 $N$
import numpy as np
from plot_fxy import plot_color2d


if __name__ == "__main__":
    Nx = 6
    Ny = 6
    x_arr = np.linspace(-2.5, 2.5, Nx)
    y_arr = np.linspace(-1.5, 3.5, Ny)
    x, y = np.meshgrid(x_arr, y_arr)
    z = np.exp(-0.4 * (x - 0) ** 2) * np.exp(-1 * (y - 0) ** 2)

    z = z[:-1, :-1]
    print(f"x | {x_arr}") # x | [-2.5 -1.5 -0.5  0.5  1.5  2.5]
    print(f"y | {y_arr}") # y | [-1.5 -0.5  0.5  1.5  2.5  3.5]
    print(f"x size = {x.shape[0]}, {x.shape[1]}") # x size = 6, 6
    print(f"y size = {y.shape[0]}, {y.shape[1]}") # y size = 6, 6
    print(f"z size = {z.shape[0]}, {z.shape[1]}") z size = 5, 5

    plot_color2d(
        x,
        y,
        z,
        show_gui=True,
        output_image_name="out_region.png",
        aspect_ratio="equal",
        x_range=(-4.5, 4.5),
        x_grid="both",
        y_range=(-4, 5),
        y_grid="both",
        color_range=(0, 1),
    )
生成される画像
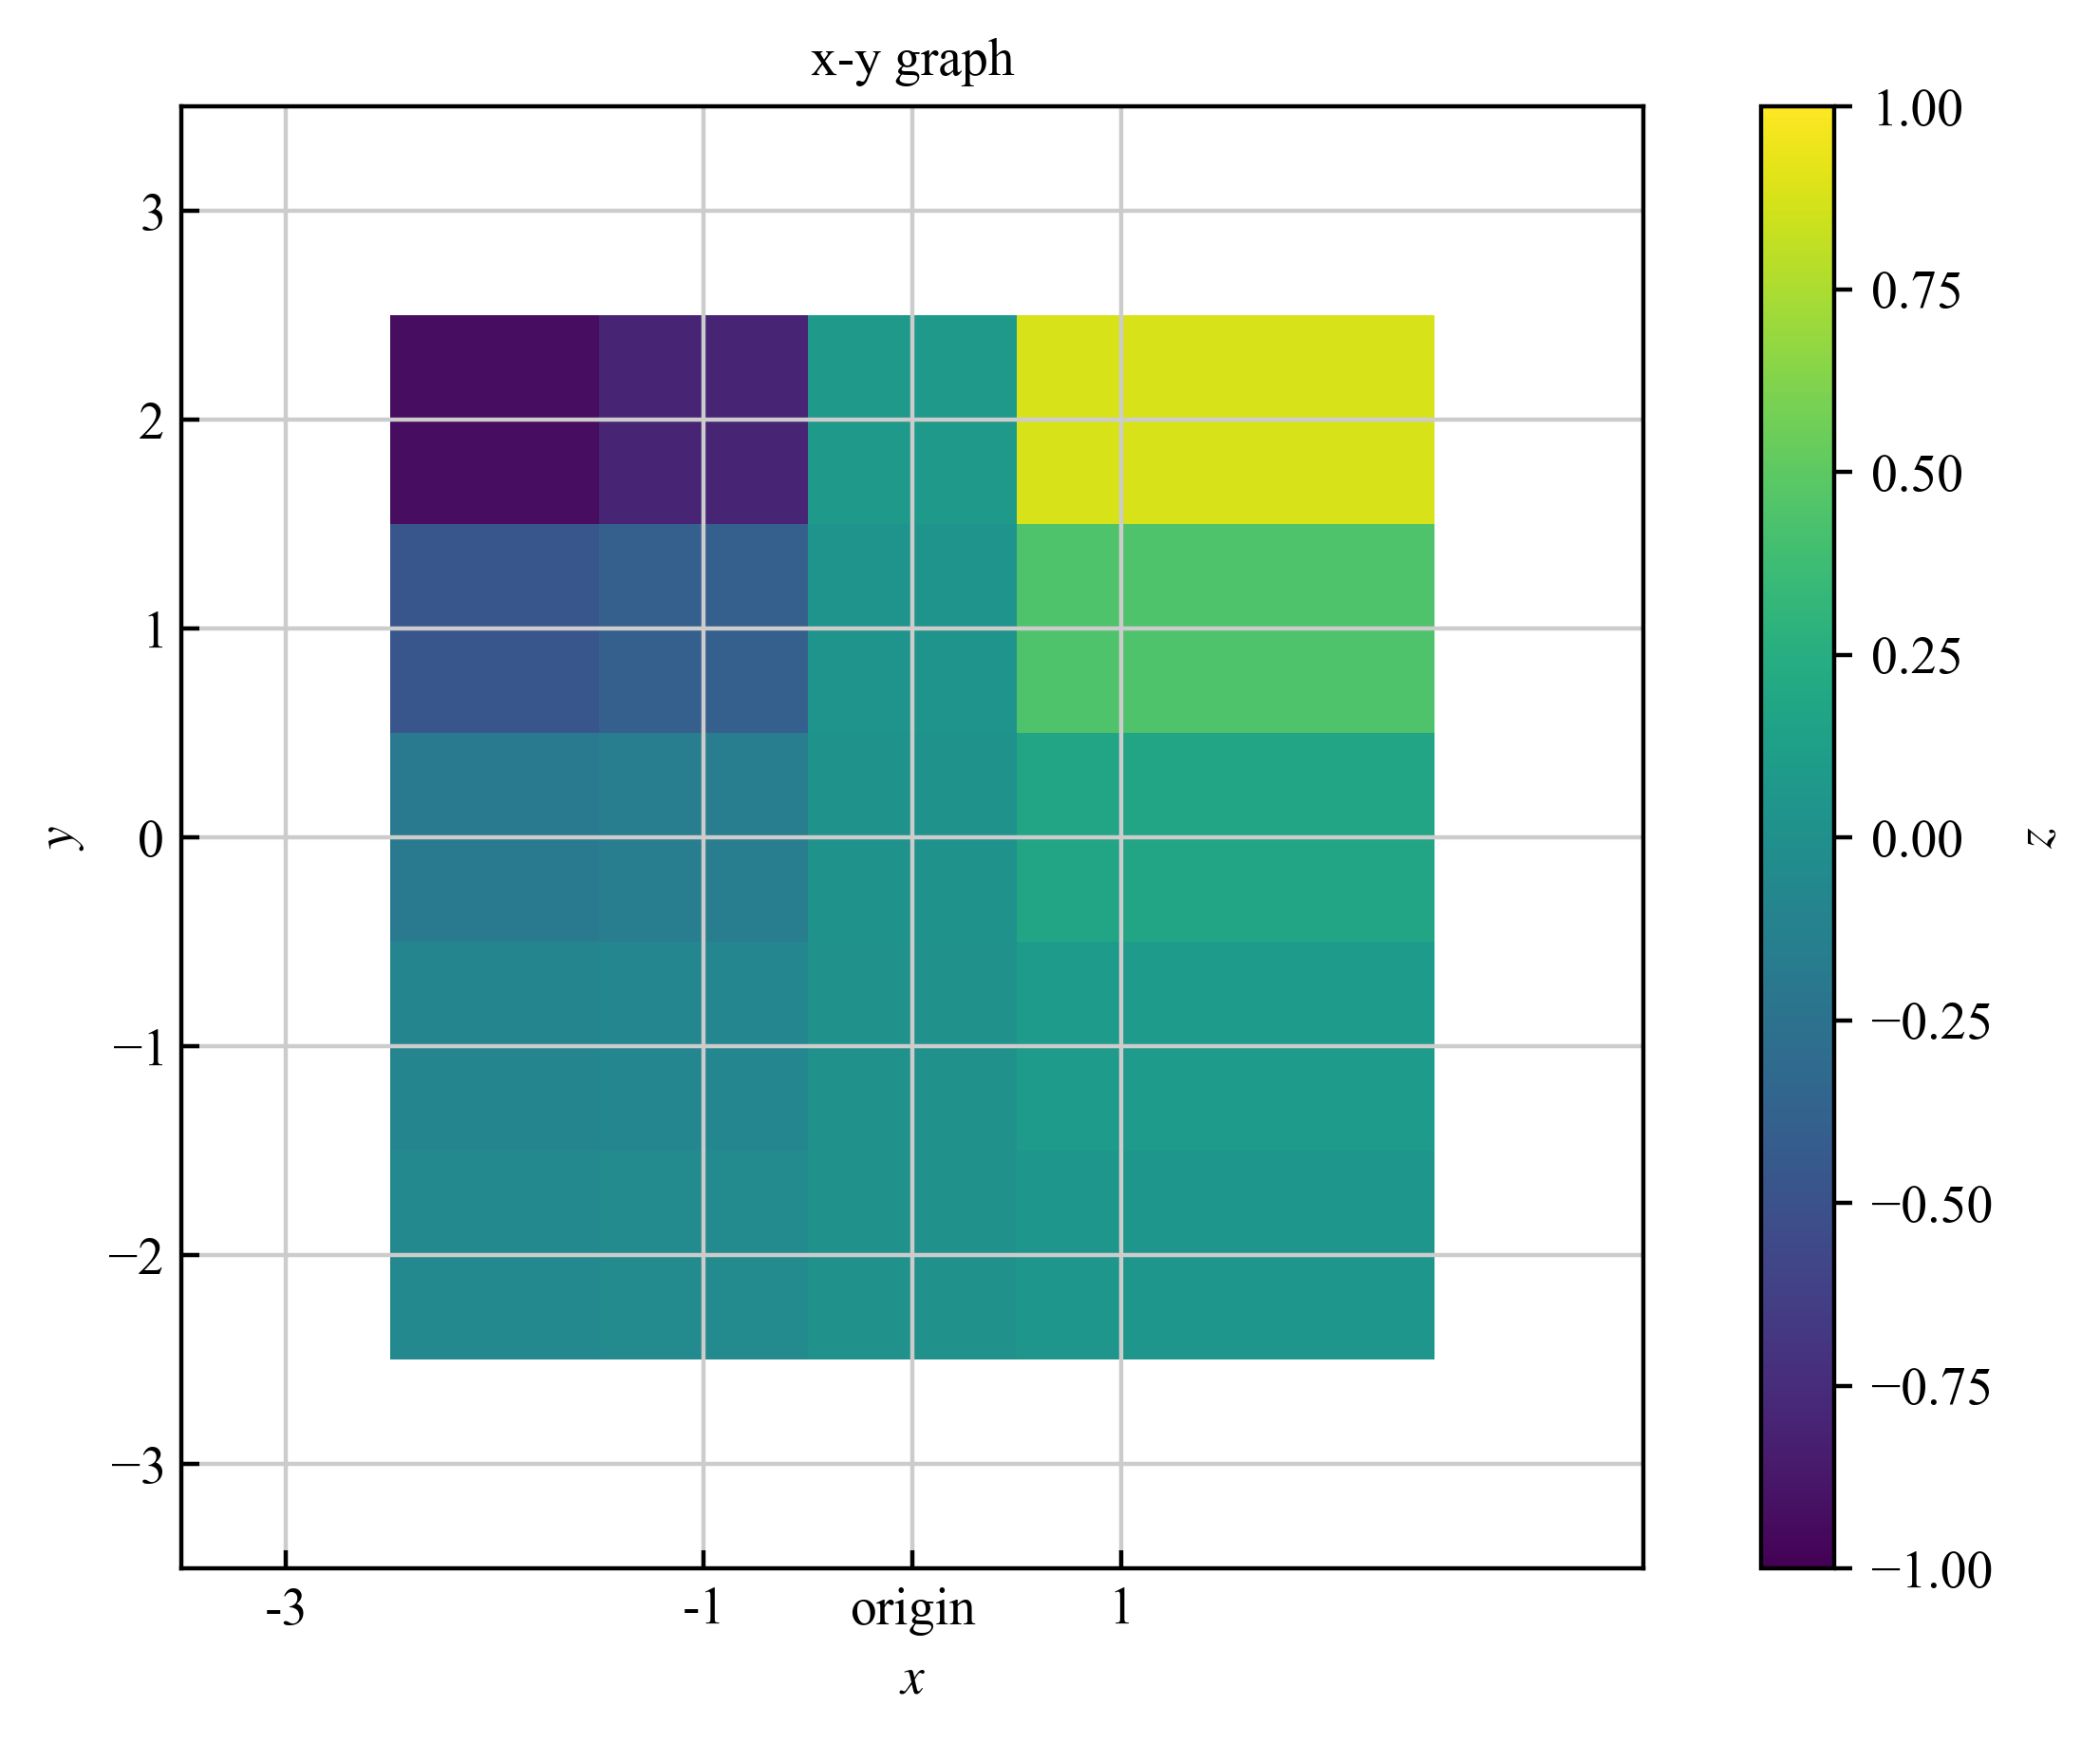
2.2.3. その他実装 #
import numpy as np
from plot_fxy import plot_color2d

if __name__ == "__main__":
    N = 6
    x_arr = np.linspace(-2.5, 2.5, N)
    y_arr = np.linspace(-2.5, 2.5, N)
    x, y = np.meshgrid(x_arr, y_arr)

    z = np.cos(x - 1) * (1.0 / ((y - 1.5) ** 2 + 1))
    z = z[:-1, :-1]

    output_image = "out_data_center.png"
    x_ticks_manual = ((-3, -1, 0, 1), (-3, -1, "origin", 1))
    color_ticks_manual = ([1e-10, 1e-9, 1e-5, 1], ["1e-10", "$10^{-9}$", "$10^{-5}$", "1"])
    plot_color2d(
        x,
        y,
        z,
        legend_label=None,
        output_image_name=output_image,
        figure_size=(8, 5),
        aspect_ratio="equal",
        show_gui=True,
        x_base=1,
        x_range=(-3.5, 3.5),
        x_start_tick=-3,
        # x_end_tick=2,
        x_ticks_manual=x_ticks_manual,
        x_scale="linear",
        is_x_minor_ticks=False,
        x_minor_division=2,
        x_grid="both",
        y_base=1,
        y_range=(-3.5, 3.5),
        y_start_tick=-3,
        y_scale="linear",
        y_grid="both",
        is_y_minor_ticks=False,
        y_minor_division=2,
        # color_map_name="jet",
        color_scale="linear",
        color_range=(-1, 1),
        # color_ticks_manual=color_ticks_manual,
    )
生成される画像